. 2002 Jan 8;99(1):155-60.
doi: 10.1073/pnas.221593598. Epub 2001 Dec 26.

Exploring the folding landscape of a structured RNA

Affiliations

Exploring the folding landscape of a structured RNA

Rick Russell et al. Proc Natl Acad Sci U S A. .

Abstract

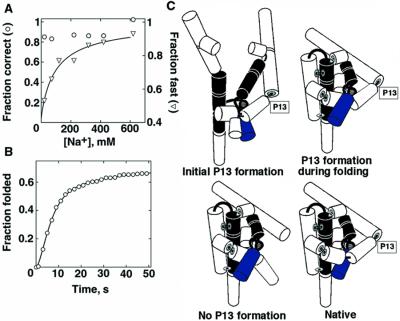
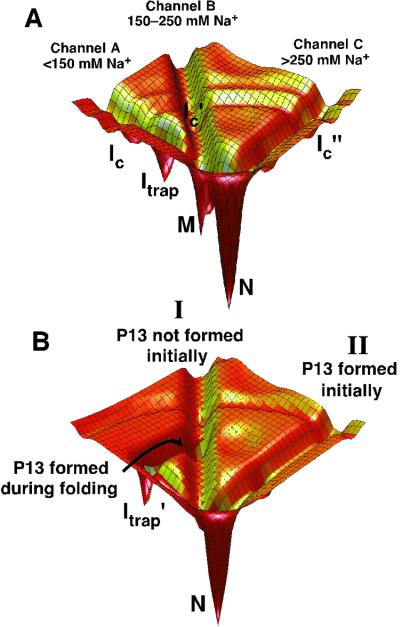
Structured RNAs achieve their active states by traversing complex, multidimensional energetic landscapes. Here we probe the folding landscape of the Tetrahymena ribozyme by using a powerful approach: the folding of single ribozyme molecules is followed beginning from distinct regions of the folding landscape. The experiments, combined with small-angle x-ray scattering results, show that the landscape contains discrete folding pathways. These pathways are separated by large free-energy barriers that prevent interconversion between them, indicating that the pathways lie in deep channels in the folding landscape. Chemical protection and mutagenesis experiments are then used to elucidate the structural features that determine which folding pathway is followed. Strikingly, a specific long-range tertiary contact can either help folding or hinder folding, depending on when it is formed during the process. Together these results provide an unprecedented view of the topology of an RNA folding landscape and the RNA structural features that underlie this multidimensional landscape.


Figures

Figure 1
Figure 1
Exploring the folding landscape. (A) Folding was initiated by flowing buffer containing 5 mM Mg2+ over the surface-attached ribozyme, replacing the 170 mM Na+ solution present initially. The fraction of molecules that attained FRET values of ≈0.9, indicating native-state formation, is plotted against folding time. The curve represents a fit by two exponentials with rate constants of 1.21 ± 0.07 s−1 and 0.025 ± 0.001 s−1. The combined amplitude of these two folding phases, 0.219 ± 0.003, represents the fraction of ribozyme that folded to the native state without forming the long-lived misfolded state. (B) The fraction of ribozyme that folded correctly (○), and the fraction of the correct-folding molecules that folded fast (≈1 s−1, ▿), are plotted against initial Na+ concentration. Only the correct-folding molecules were analyzed for the rate of folding because the molecules that misfold do not give a detectable change in FRET value after formation of an early intermediate (22). The dependence of fast folding on Na+ concentration gave a half-maximal value for Na+ (K1/2) of 183 ± 9 mM and a Hill coefficient (n) of 4.4 ± 0.9. For correct folding, these values were K1/2 = 267 ± 8 mM, n = 5.0 ± 0.7.
Scheme 1
Scheme 1
Figure 2
Figure 2
Structural changes in the starting ensemble monitored by SAXS. Kratky plots are shown for the standard L-21 ScaI ribozyme at 25°C in buffer containing 20 mM Na+ (black), 70 mM Na+ (blue), 120 mM Na+ (green), 420 mM Na+ (red), 820 mM Na+ (purple), the intermediate Itrap (orange, formed at 15°C), and the native ribozyme in buffer containing 15 mM Mg2 + (brown). Kratky plots have the form of I(S)S2 against S, where I(S) is scattering intensity and S is related to the scattering angle [S = 2sinθ/λ, where λ is the x-ray wavelength, 1.54 Å, and 2θ is the scattering angle (35)].
Figure 3
Figure 3
Structural changes in the starting ensemble monitored by DMS accessibility. Residues that increase in protection from DMS in the presence of NaCl are indicated with filled circles. Residues that gave an Na+ concentration for half-maximal protection (K1/2) < 100 mM are colored yellow (C315, C316, C332, C371), residues that gave K1/2 values between 100 mM and 300 mM Na+ are green (C278, A347, A351, A352), and residues with K1/2 > 300 mM Na+ are blue (A151–153, A196, C216, C217, A246). Results are for the standard L-21 ScaI ribozyme in the presence of bound S. The extended version used for single-molecule experiments gave an indistinguishable Na+ dependence of DMS protection (data not shown), suggesting that the structural changes induced by Na+ are similar for the two versions of the ribozyme. The strands that pair to form Alt P3, which can replace P3 (3), are shown with thick lines.
Figure 4
Figure 4
Structural changes responsible for distinct folding properties. (A) Folding of the U273A variant ribozyme, in which P3 is stabilized. The fraction of ribozyme molecules that folded correctly (○) and fast (▿) are plotted against initial Na+ concentration. A fit by the Hill equation gave values for fast folding of K1/2 = 100 ± 50 mM Na+ and n = 0.9 ± 0.2. (B) Folding of the ΔP13 variant (U75A, G76C, C77G), in which P13 is disrupted. The ribozyme also contained the U273A substitution, allowing it to avoid the long-lived misfolded form. An increase in rate at early times (a kinetic lag) was observed, necessitating two rate constants of 0.30 ± 0.04 s−1 and 0.29 ± 0.04 s−1 to describe the fast phase of folding [620 mM Na+ initially; similar results were obtained with an initial Na+ concentration of 20 mM. A small fraction (10%) folded slowly, giving a third rate constant of 0.038 ± 0.005 s−1]. These two larger rate constants are the same within error as that for docking of the P1 duplex (0.23 s−1; unpublished results). As docking is required for efficient FRET (22), the other rate constant of 0.3 s−1 is assigned to overall folding. (C) Model for the effects of P13 formation on folding (see text). The model reflects folding in the context of preformed P3, shown as two thick lines connected by thin lines. Other secondary structure elements are shown as cylinders, and long-range contacts are shown as thin connecting lines.
Figure 5
Figure 5
RNA folding pathways contained in channels. (A) A schematic of channels for the wild-type ribozyme. The dependence of folding properties on initial conditions indicates the presence of free energy barriers between the channels, whereas the figure is contoured by internal free energy (9, 10). At least some of these barriers are likely to be present when considering internal free energy because interconversion between the starting states requires base pairs to exchange. Therefore, “walls” are shown separating the channels. The simplest model is shown, in which there are three pathways, A–C, that lie in channels A, B, and C, respectively. Pathways A and B predominate at low initial Na+ concentration, pathway B at intermediate Na+ concentration, and pathway C at high Na+ concentration. The fast-folding fraction under low Na+ conditions could instead arise from an additional pathway that branches from pathway A during folding before the formation of Itrap (not shown). Ic is a collapsed intermediate that forms along pathway A (R.R., I.S.M., M. Tate, L. Kwok, B. Nakatani, V. Pande, S. Gruner, S. Mochrie, S.D., D.H., and L. Pollack, unpublished data), and analogous intermediates are postulated along pathways B and C. (B) Effects of P13 formation during folding starting with a preformed P3 (see text). The landscape for folding of the U273A ribozyme is depicted for simplicity, in which the long-lived misfolded form is not formed significantly and is therefore not shown.

Similar articles

Cited by

References

    1. Zarrinkar P P, Williamson J R. Science. 1994;265:918–924. - PubMed
    1. Sclavi B, Sullivan M, Chance M R, Brenowitz M, Woodson S A. Science. 1998;279:1940–1943. - PubMed
    1. Pan J, Woodson S A. J Mol Biol. 1998;280:597–609. - PubMed
    1. Treiber D K, Rook M S, Zarrinkar P P, Williamson J R. Science. 1998;279:1943–1946. - PubMed
    1. Rook M S, Treiber D K, Williamson J R. J Mol Biol. 1998;281:609–620. - PubMed

Publication types

LinkOut - more resources