

Exploring relationships in gene expressions: a partial least squares approach
- PMID: 11763996
- PMCID: PMC5964946
- DOI: 10.3727/000000001783992498
Exploring relationships in gene expressions: a partial least squares approach
Abstract
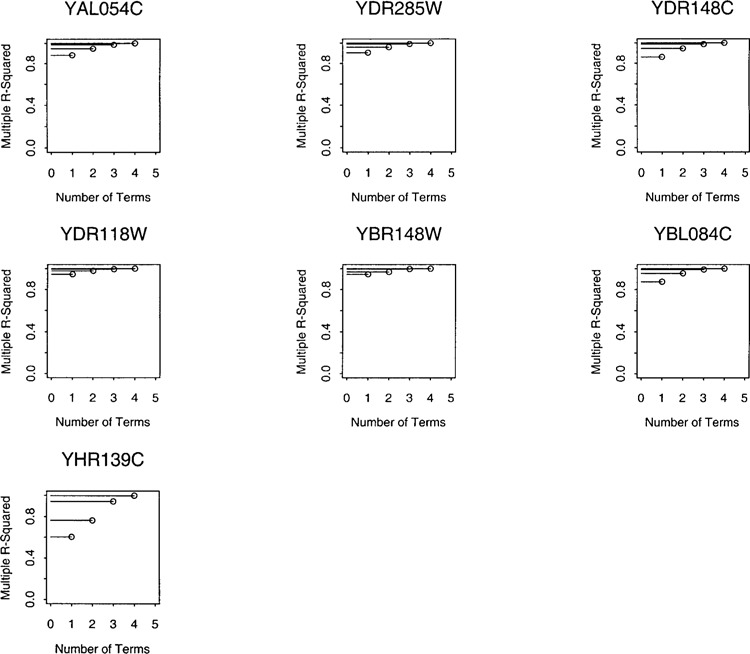
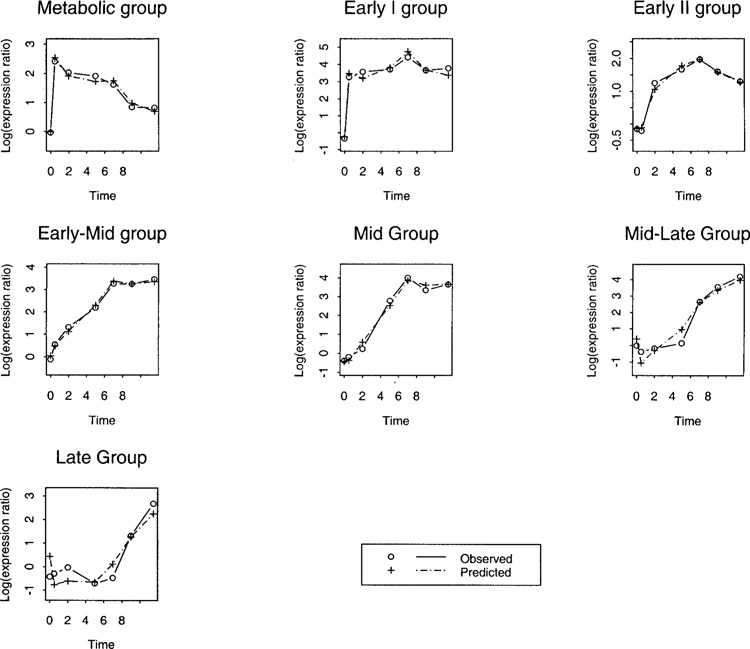
Microarray technology has revolutionized the way gene functions are monitored. Analysis of microarray data is a fast growing research area that interfaces various disciplines such as biology, biochemistry, computer science, and statistics. While various clustering and classification techniques have been successfully employed to group genes based on the similarity of their expression patterns, much is yet to be learned about the interrelationship of the expression levels among various genes. We approach this problem with a statistical technique called partial least squares that is capable of modeling a large number of variables each with relatively few observations. This property of the partial least squares methodology appears to be attractive for application to microarray data sets where the simultaneous expression levels of many genes are collected each at a few time points (or individuals). We use it to analyze publicly available microarray data on sporulation of budding yeast (Saccharomyces cerevisiae). We investigate a number of representative genes, one from each temporal group (based on the time of first induction) of positively expressed genes and show that in each case most of the variability was explained by only two partial regression terms based on all remaining genes. Moreover, the predicted expression levels of the representative genes from partial least squares fit very well on the average with the true expression levels over time. Finally, we compare the biological functions of the genes with largest coefficients with those of the predicted genes. In many cases, the genes are involved in similar or related biological functions including negative relationships. We show that this method can identify established gene relationships; we argue that it can be an exploratory tool for identifying potential gene relationships requiring further biological investigation.
Figures
References
-
- Brazma A.; Vilo J. Minireview: Gene expression data analysis. FEBS Lett. 480:2–16; 2000. - PubMed
-
- Brown P. J. Measurement, regression, and calibration. New York: Oxford University Press, Inc.; 1993.
-
- Chu S.; DeRisi J. L.; Eisen M.; Mulholland J.; Botstein D.; Brown P. O.; Herskowtiz I. The transcriptional program of sporulation in budding yeast. Science 282:699–705; 1998. - PubMed
-
- DeRisi J. L.; Vishwanath R. I.; Brown P. O. Exploring the metabolic and genetic control of gene expression on a genomic scale. Science 278:680–686; 1997. - PubMed
Publication types
MeSH terms
LinkOut - more resources
Full Text Sources
Other Literature Sources
Molecular Biology Databases