Review
. 2001 Nov;96(6):582-94.
doi: 10.1007/s003950170010.

The mechanical and metabolic basis of myocardial blood flow heterogeneity

Affiliations
Review

The mechanical and metabolic basis of myocardial blood flow heterogeneity

J B Bassingthwaighte et al. Basic Res Cardiol. 2001 Nov.

Abstract

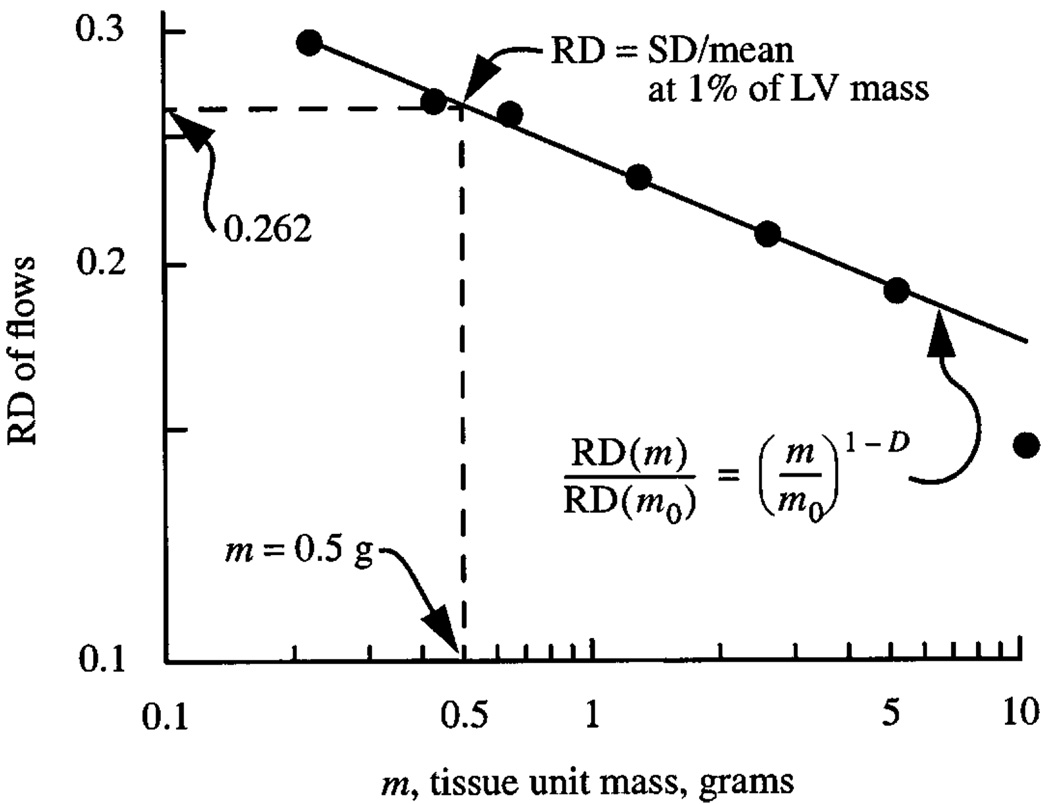
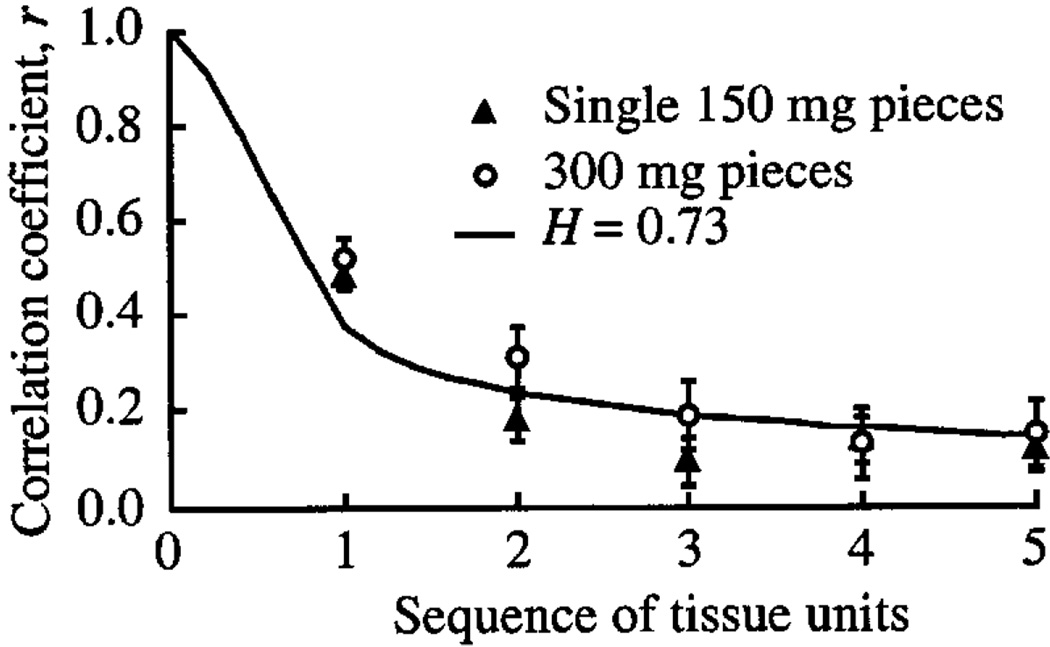
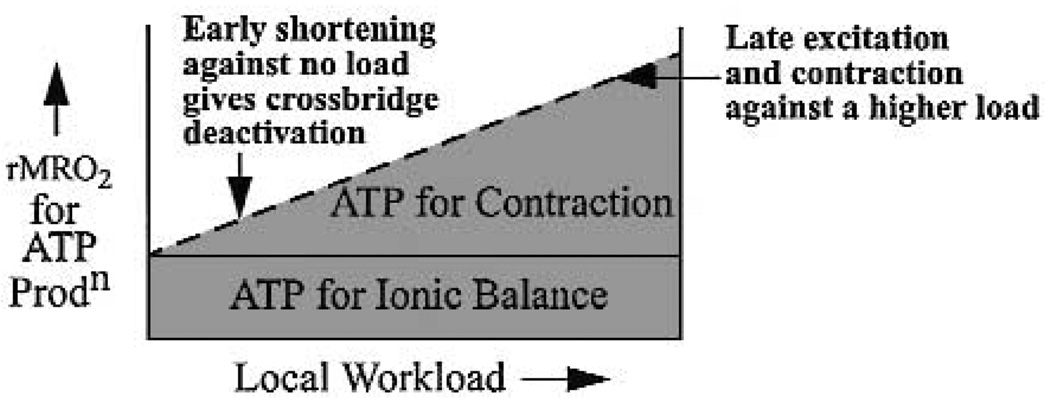
Precise measurements of regional myocardial blood flow heterogeneity had to be developed before one could seek causation for the heterogeneity. Deposition techniques (particles or molecular microspheres) are the most precise, but imaging techniques have begun to provide high enough resolution to allow in vivo studies. Assigning causation has been difficult. There is no apparent association with the regional concentrations of energy-related enzymes or substrates, but these are measures of status, not of metabolism. There is statistical correlation between flow and regional substrate uptake and utilization. Attribution of regional flow variation to vascular anatomy or to vasomotor control appears not to be causative on a long-term basis. The closest relationships appear to be with mechanical function, but one cannot say for sure whether this is related to ATP hydrolysis at the crossbridge or associated metabolic reactions such as calcium uptake by the sarcoplasmic reticulum.


Figures

Fig. 1
Fig. 1
Normalization of heterogeneity estimate. The RD, relative dispersion of regional flows, is the standard deviation of the regional flows in regions of size m in grams divided by the mean flow for all the regions together, in this case the whole left ventricle, LV. The LV mass was 50 g. The dashed vertical line at 0.5 g, 1% of LV mass, intercepts the observed fractal relationship at RD = 0.262. The regression equation is RD(m) = 0.232 (m/m0)−0.18 using m0 = 1 g. The fractal dimension D = 1.18. (Data are from 11 sheep. See (12)).
Fig. 2
Fig. 2
Correlation between flows in successive tissue units in a series. Sequence number 1 means adjacent units. The correlation, given by the line described by Eq. 1, falls off similarly for 150-mg units (▲) and 300-mg units (○), even though the latter are actually twice the distance between centers. A value of H = 0.73 or D = 1.27 describes the falloff.
Fig. 3
Fig. 3
Analysis of casts of the coronary left anterior descending arterial tree of a pig heart: length, L, of average element (i.e., segments in series) of a given generation versus the average diameter, d, of the lumen. The logarithmic slope is 1.053. (The data points are average values from (50), Table 1, left anterior descending coronary artery.)
Fig. 4
Fig. 4
Diagram of oxygen consumption with respect to local needs for ATP. ATP required for ionic balance is probably almost independent of work load, except perhaps for Ca++ cycling, and myosin ATPase flux is related to local work.
Fig. 5
Fig. 5
Electrical activation, regional shortening patterns and blood flows in a 5 by 4 cm patch of dog LV free wall divided into 16 regions. Upper panels (A): Normal sinus activation. Middle panels (B): RV outflow tract stimulation. Lower panels (C): LV apical stimulation. Left column of panels: Electrical activation times, ms. Middle column: Strains (fractional length changes) during systolic ejection phase are shown numerically, negative sign indicating shortening; to the sides are continuous recordings of the regional segment lengths between epicardial markers. Pre-ejection negative strain → shortening deactivation. Right column: rMBF values in underlying myocardium by the microsphere technique. (Composite figure made from various figures of (75), with permission.)

References

    1. Allen DG, Kurihara S. The effect of muscle length on intracellular calcium transient in mammalian cardiac muscle. J Physiol. 1981;327:79–94. - PMC - PubMed
    1. Allen DG, Kentish JC. The cellular basis of the length-tension relation in cardiac muscle. J Mol Cell Cardiol. 1985;17:821–840. - PubMed
    1. Altehoefer C. Editorial: LBBB: challenging our concept of metabolic heart imaging with fluorine-18-FDG and PET. J Nucl Med. 1998;39:263–265. - PubMed
    1. Armour JA, Ardell JL. Neurocardiology. New York: Oxford University Press; 1994.
    1. Austin RE, Jr, Aldea GS, Coggins DL, Flynn AE, Hoffman JIE. Profound spatial heterogeneity of coronary reserve: discordance between patterns of resting and maximal myocardial blood flow. Circ Res. 1990;67:319–331. - PubMed

Publication types

LinkOut - more resources