. 2002 Jan;68(1):235-44.
doi: 10.1128/AEM.68.1.235-244.2002.

Single-base-pair discrimination of terminal mismatches by using oligonucleotide microarrays and neural network analyses

Collaborators, Affiliations

Single-base-pair discrimination of terminal mismatches by using oligonucleotide microarrays and neural network analyses

Hidetoshi Urakawa et al. Appl Environ Microbiol. 2002 Jan.

Abstract

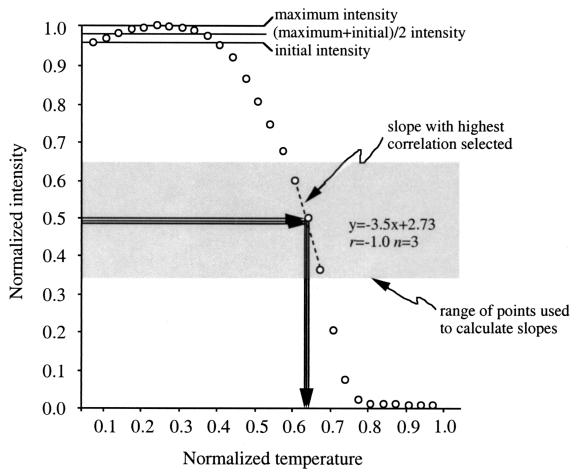
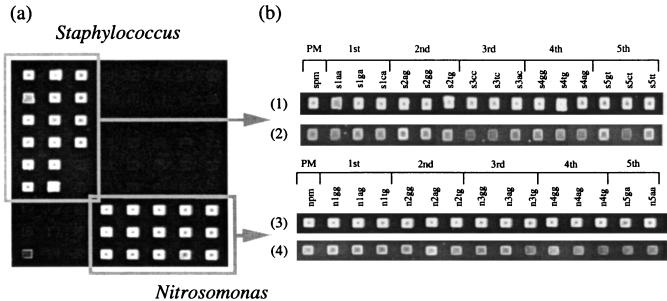
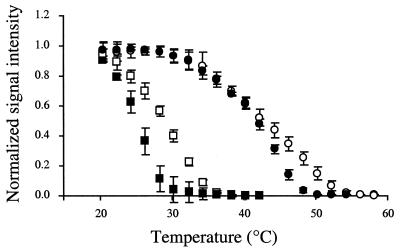
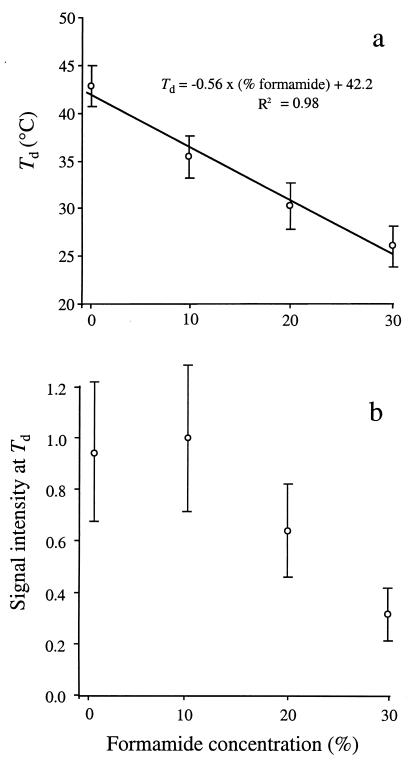
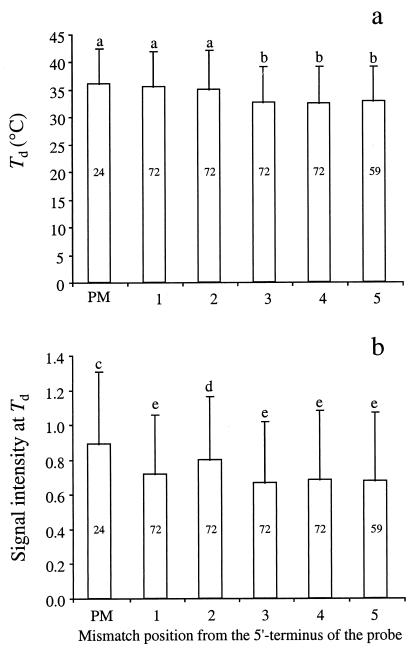
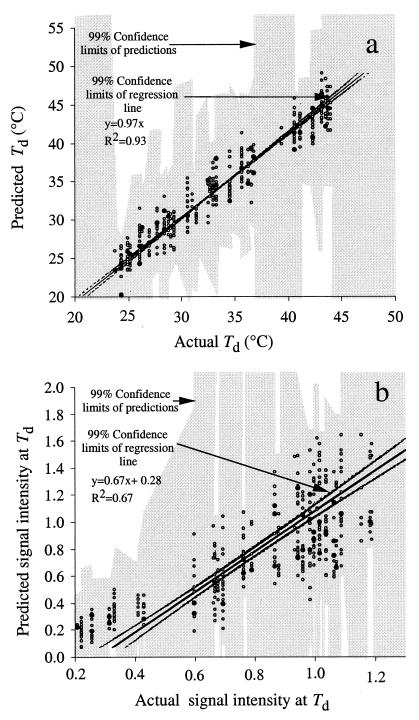
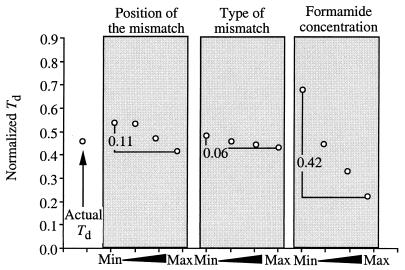
The effects of single-base-pair near-terminal and terminal mismatches on the dissociation temperature (T(d)) and signal intensity of short DNA duplexes were determined by using oligonucleotide microarrays and neural network (NN) analyses. Two perfect-match probes and 29 probes having a single-base-pair mismatch at positions 1 to 5 from the 5' terminus of the probe were designed to target one of two short sequences representing 16S rRNA. Nonequilibrium dissociation rates (i.e., melting profiles) of all probe-target duplexes were determined simultaneously. Analysis of variance revealed that position of the mismatch, type of mismatch, and formamide concentration significantly affected the T(d) and signal intensity. Increasing the concentration of formamide in the washing buffer decreased the T(d) and signal intensity, and it decreased the variability of the signal. Although T(d)s of probe-target duplexes with mismatches in the first or second position were not significantly different from one another, duplexes with mismatches in the third to fifth positions had significantly lower T(d)s than those with mismatches in the first or second position. The trained NNs predicted the T(d) with high accuracies (R(2) = 0.93). However, the NNs predicted the signal intensity only moderately accurately (R(2) = 0.67), presumably due to increased noise in the signal intensity at low formamide concentrations. Sensitivity analysis revealed that the concentration of formamide explained most (75%) of the variability in T(d)s, followed by position of the mismatch (19%) and type of mismatch (6%). The results suggest that position of the mismatch at or near the 5' terminus plays a greater role in determining the T(d) and signal intensity of duplexes than the type of mismatch.


Figures

FIG. 1.
FIG. 1.
Effect of maximum and initial signal intensities on the calculated Td. Three Tds were calculated based on the midpoints of initial, (maximum + initial)/2, and maximum intensities corresponding to the transition from DNA duplex to random coil. Shown is an intensity-temperature profile for the S. epidermidis target probe s2ag and the target sequence. The normalized Tds were calculated to be 0.63, 0.64, and 0.64, which correspond to Tds of 47.9, 48.3, and 48.1°C, respectively.
FIG. 2.
FIG. 2.
(a) Typical image of a DNA microarray; (b) fluorescence images of perfect match (PM) duplexes and duplexes with a single-base-pair mismatch. Single-base-pair mismatches are located at the first to fifth positions from the 5′ terminus of the probe. After hybridization, the microarrays were washed with a washing buffer containing 0 or 30% formamide (see Materials and Methods). 1, S. epidermidis, 0% formamide; 2, S. epidermidis, 30% formamide; 3, N. eutropha, 0% formamide; 4, N. eutropha, 30% formamide.
FIG. 3.
FIG. 3.
Effect of formamide concentration on the melting profiles of n4gg and N. eutropha target. The single-base-pair mismatch occurs at the fourth position from the 5′ terminus of the probe. Open circles, perfect-match Nitrosomonas probe in 0% formamide; closed circles, n4gg in 0% formamide; open squares, perfect-match Nitrosomonas probe in 30% formamide; closed squares, n4gg in 30% formamide.
FIG. 4.
FIG. 4.
Effect of formamide concentration on Td (a) and signal intensity at Td (b) of probe-target duplexes. Each circle is the mean of at least 92 Tds, and each error bar represents the standard deviation of the mean.
FIG. 5.
FIG. 5.
Effect of position of the single-base-pair mismatch on Td (a) and signal intensity at Td (b). PM, Perfect-match duplex. Samples with the same letter are not significantly different (α = 0.05) as determined by the SNK test. Numbers in the center of the bars are the numbers of samples represented.
FIG. 6.
FIG. 6.
Relationship between actual and predicted Td (a) and signal intensity (b) as determined with an NN. Each datum represents a single sample. Open circles, data used to train the NN (n = 347); closed circles, data used to test the NN (n = 39). Confidence limits of the predictions (shaded) were calculated with a sliding window of 10 sampling points. The confidence limits of regression line and the predictions (shaded) were based on training and test data (n = 386).
FIG. 7.
FIG. 7.
Sensitivity analysis of one sample (position = 5, type = 1, and formamide = 10 and corresponding normalized Td) showing the change in Td as a function of increasing position, from its minimum value of 0 to its maximum value of 5, type, from its minimum value of 0 to its maximum value of 1, and formamide, from its minimum value of 0 to its maximum value of 30. Formamide concentration had the largest change in normalized Td, followed by position of the mismatch and then type of mismatch. The sum of the changes in Td for all inputs is 0.59 (0.11 + 0.06 + 0.42). The corresponding relative sensitivity of position is the change in Td/sum of the changes in Td for all inputs, which in this case is 0.11/0.59, or 0.19. The corresponding relative sensitivities of type of mismatch and formamide concentration are 0.10 and 0.71, respectively.

References

    1. Aleksander, I., and H. Morton. 1991. An introduction to neural computing, p.1–20. Chapman & Hall, Ltd., London, United Kingdom.
    1. Almeida, J. S., and P. A. Noble. 2000. Neural computing in microbiology. J. Microbiol. Methods 43:1–2. - PubMed
    1. Altschul, S. F., W. Gish, W. Miller, E. W. Myers, and D. J. Lipman. 1990. Basic local alignment search tool. J. Mol. Biol. 215:403–410. - PubMed
    1. Basheer, I. A., and M. Hajmeer. 2000. Artificial neural networks: fundamentals, computing, design, and application. J. Microbiol. Methods 43:3–31. - PubMed
    1. Bavykin, S. G., J. P. Akowski, V. M. Zakhariev, V. E. Barsky, A. N. Perov, and A. D. Mirzabekov. 2001. Portable system for microbial sample preparation and oligonucleotide microarray analysis. Appl. Environ. Microbiol. 67:922–928. - PMC - PubMed

Publication types

LinkOut - more resources