. 2002 Jan;40(1):52-60.
doi: 10.1128/JCM.40.1.52-60.2002.

Modeling of 5' nuclease real-time responses for optimization of a high-throughput enrichment PCR procedure for Salmonella enterica

Affiliations

Modeling of 5' nuclease real-time responses for optimization of a high-throughput enrichment PCR procedure for Salmonella enterica

Rickard Knutsson et al. J Clin Microbiol. 2002 Jan.

Abstract

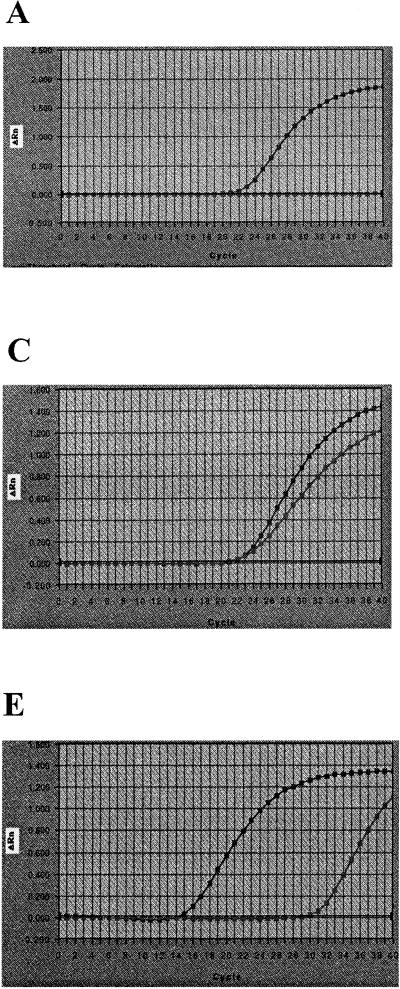
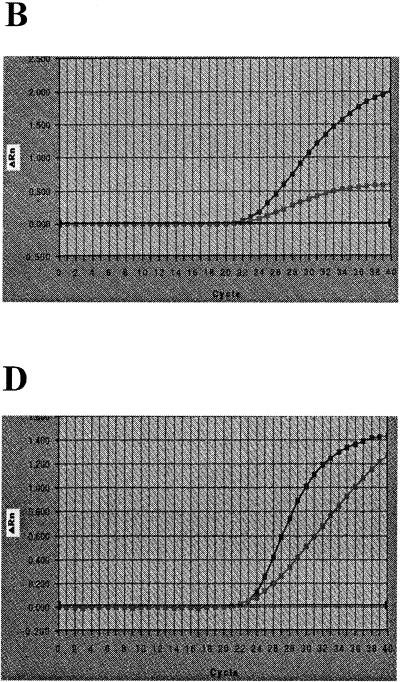
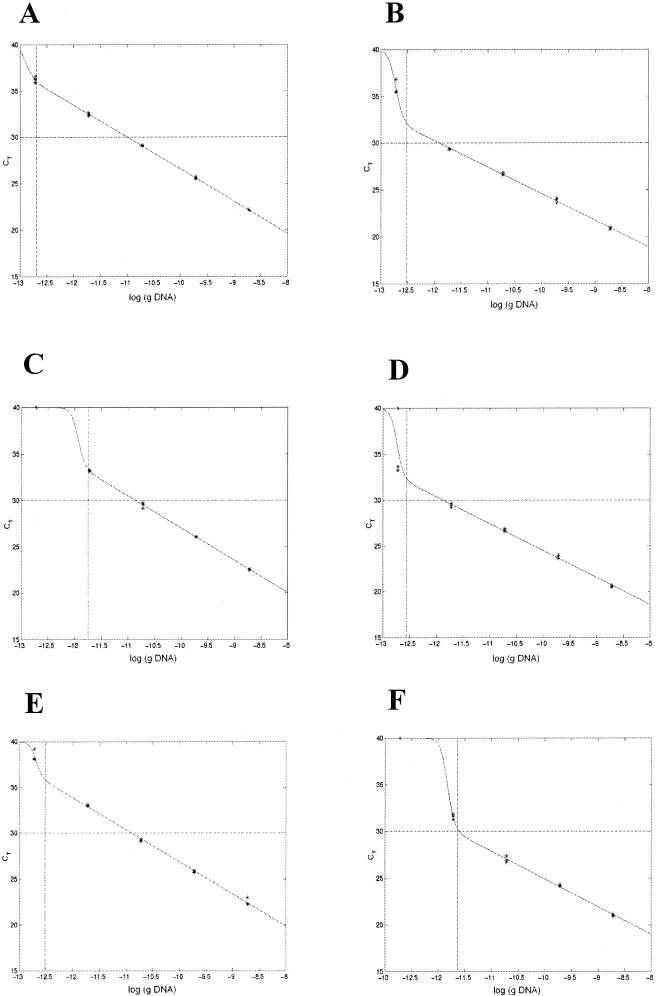
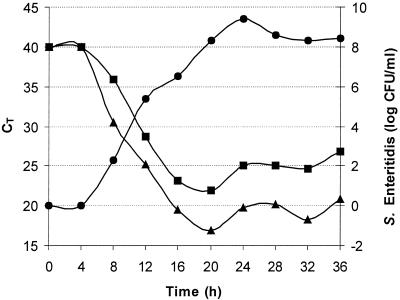
The performance of a 5' nuclease real-time PCR assay was studied to optimize an automated method of detection of preenriched Salmonella enterica cells in buffered peptone water (BPW). The concentrations and interactions of the PCR reagents were evaluated on the basis of two detection responses, the threshold cycle (C(T)) and the fluorescence intensity by a normalized reporter value (DeltaR(n)). The C(T) response was identified as the most suitable for detection modeling to describe the PCR performances of different samples. DNA extracted from S. enterica serovar Enteritidis was studied in double-distilled H2O (ddH2O) and in two different enrichment media (brain heart infusion and BPW) with two PCR mixtures based on AmpliTaq Gold or rTTH: A descriptive model was proposed and fitted to the available experimental data. Equivalent PCR performances for the two PCR mixtures were obtained when DNA was diluted in ddH2O. However, the level of detection of DNA was affected when BPW was present during amplification. Use of the rTth mixture generated a 1-log-unit wider linear range of amplification, and the DNA detection levels were 2 x 10(-13) g/microwell for the rTth mixture and 2 x 10(-12) g/microwell for the AmpliTaq Gold mixture. To verify the improved amplification capacity of the rTth mixture, BPW was inoculated with 1 CFU of S. enterica serovar Enteritidis per ml and the mixture was incubated at 30 degrees C. Samples for PCR were withdrawn every 4 h during a 36-h enrichment. Use of the rTth mixture resulted in an earlier PCR detection during enrichment than use of the AmpliTaq Gold mixture. For accurate detection (C(T) < or = 30) of S. enterica serovar Enteritidis inoculated in BPW, the rTth mixture required 8.4 h of enrichment, while the AmpliTaq Gold mixture needed 11.6 h. In conclusion, the principle applied can improve the methodology of 5' nuclease real-time PCR for numerical optimization of sample pretreatment strategies to provide automated diagnostic PCR procedures.


Figures

FIG. 1.
FIG. 1.
Graphical illustration of Salmonella DNA amplification kinetics of the 5′ nuclease PCR assay (13) for the low and high axial levels used in the factorial design experiment. In all five graphs (A to E) the highest final ΔRn was obtained for the high axial concentrations of each PCR reagent. All PCR reagents except the PCR reagent being studied are at the concentration of the center level (Table 1). (A) High (4.7 mM) and low (0.1 mM) MgCl2 concentrations; (B) high (160 nM) and low (40 nM) probe concentrations; (C) high (1,600 nM) and low (185 nM) primer (both forward and reverse primers) concentrations; (D) high (0.10 U/μl) and low (0.02 U/μl) AmpliTaq Gold concentrations; (E) high (2 × 10⁻⁶ g/microwell) and low (2 × 10⁻¹¹ g/microwell) DNA concentrations.
FIG. 1.
FIG. 1.
Graphical illustration of Salmonella DNA amplification kinetics of the 5′ nuclease PCR assay (13) for the low and high axial levels used in the factorial design experiment. In all five graphs (A to E) the highest final ΔRn was obtained for the high axial concentrations of each PCR reagent. All PCR reagents except the PCR reagent being studied are at the concentration of the center level (Table 1). (A) High (4.7 mM) and low (0.1 mM) MgCl2 concentrations; (B) high (160 nM) and low (40 nM) probe concentrations; (C) high (1,600 nM) and low (185 nM) primer (both forward and reverse primers) concentrations; (D) high (0.10 U/μl) and low (0.02 U/μl) AmpliTaq Gold concentrations; (E) high (2 × 10⁻⁶ g/microwell) and low (2 × 10⁻¹¹ g/microwell) DNA concentrations.
FIG. 2.
FIG. 2.
Graphical appearance of the model used to estimate PCR performance. The experiment was performed three times with 10-fold dilutions of DNA, and the model (the line connecting the datum points) fits the experimental data (✻) that were obtained well. Salmonella DNA amplification took place in the presence of ddH2O and different media with two amplification mixtures: (A) AmpliTaq Gold with ddH2O; (B) rTth with ddH2O; (C) AmpliTaq Gold with BPW; (D) rTth with BPW; (E) AmpliTaq Gold with BHI; (F) rTth with BHI. The vertical dashed lines in all graphs are the log DNA concentration at a detection probability of 0.95 from the estimated model. The horizontal dashed lines at CT equal to 30 marks the proposed upper limit for sufficient PCR performance. From the model the slope was determined and all graphs (A to F) gave close to optimal amplification efficiencies.
FIG. 3.
FIG. 3.
DNA amplification by the Salmonella 5′ nuclease PCR assay in the presence of 5 μl of BHI and 5 μl of BPW. The graphs show the results of the CT response at a constant Salmonella DNA concentration (2 × 10⁻⁹ g/microwell) while the concentrations of BHI and BPW in the media were changed. The experiment was performed with both the AmpliTaq Gold mixture and the rTth mixture. The PCR results correspond to the following DNA amplification combinations: AmpliTaq Gold mixture and BPW medium (⧫), AmpliTaq Gold mixture and BHI medium (▴), rTth mixture and BPW medium (⋄), and rTth mixture and BHI medium (▵).
FIG. 4.
FIG. 4.
Enrichment PCR for S. enterica serovar Enteritidis. The graph illustrates the dynamic detection range, i.e., the time during which positive detection is possible, by plotting the CT value against the incubation time. BPW was inoculated with S. enterica serovar Enteritidis at a concentration of 1 CFU/ml, and the mixture was incubated at 37°C. Samples for PCR analysis were withdrawn every 4 h. •, numbers of CFU per milliliter; ▪, results for AmpliTaq Gold mixture; ▴, results for rTth mixture.

References

    1. Abu Al-Soud, W., and P. Rådström. 1998. Capacity of nine thermostable DNA polymerases to mediate DNA amplification in the presence of PCR-inhibiting samples. Appl. Environ. Microbiol. 64:3748–3753. - PMC - PubMed
    1. Abu Al-Soud, W., and P. Rådström. 2000. Effects of amplification facilitators on diagnostic PCR in the presence of blood, feces, and meat. J. Clin. Microbiol. 38:4463–4470. - PMC - PubMed
    1. Abu Al-Soud, W., and P. Rådström. 2001. Purification and characterization of PCR-inhibitory components in blood cells. J. Clin. Microbiol. 39:485–493. - PMC - PubMed
    1. Agresti, A. 1996. An introduction to categorical data analysis. John Wiley & Sons, Inc., New York, N.Y.
    1. Bassler, H. A., S. J. Flood, K. J. Livak, J. Marmaro, R. Knorr, and C. A. Batt. 1995. Use of a fluorogenic probe in a PCR-based assay for the detection of Listeria monocytogenes. Appl. Environ. Microbiol. 61:3724–3728. - PMC - PubMed

Publication types

MeSH terms

LinkOut - more resources