

Voltage and concentration dependence of Ca(2+) permeability in recombinant glutamate receptor subtypes
- PMID: 11773314
- PMCID: PMC2290011
- DOI: 10.1113/jphysiol.2001.012897
Voltage and concentration dependence of Ca(2+) permeability in recombinant glutamate receptor subtypes
Abstract
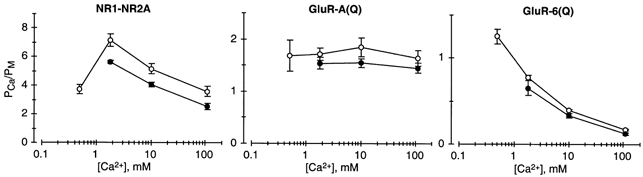
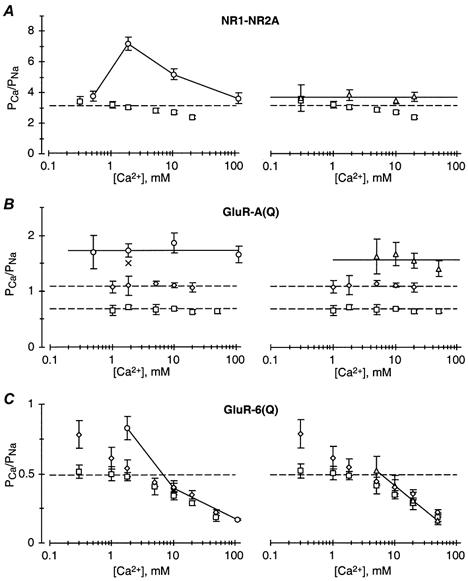
The channels associated with glutamate receptor (GluR) subtypes, namely N-methyl-D-aspartate receptors (NMDARs), and Ca(2+)-permeable alpha-amino-3-hydroxy-5-methyl-4-isoxazolepropionate receptors (AMPARs) and kainate receptors (KARs), are to varying degrees permeable to Ca(2+). To compare the mechanism of Ca(2+) influx, we measured Ca(2+) permeability relative to that of Na(+) (P(Ca)/P(Na)) using fractional Ca(2+) currents (P(f)) and reversal potential measurements over a wide voltage and Ca(2+) concentration range in recombinant NMDAR NR1-NR2A, AMPAR GluR-A(Q) and KAR GluR-6(Q) channels. For NR1-NR2A channels, P(Ca)/P(Na) derived from P(f) measurements was voltage independent but showed a weak concentration dependence. A stronger concentration dependence was found when P(Ca)/P(Na) was derived from changes in reversal potentials on going from a Na(+) reference solution to a solution with Ca(2+) as the only permeant ion ('biionic' condition). In contrast, P(Ca)/P(Na) was concentration independent when derived from changes in reversal potentials on going from a Na(+) reference solution to the same solution with added Ca(2+) ('high monovalent' condition). For GluR-A(Q) channels, P(Ca)/P(Na) derived from all three approaches was concentration independent, and for the reversal potential-based approaches were of comparable magnitude. Their most distinctive property was that P(Ca)/P(Na) derived from P(f) measurements was strongly voltage dependent. For GluR-6(Q) channels, P(Ca)/P(Na) derived from P(f) measurements was weakly voltage dependent. On the other hand, P(Ca)/P(Na) derived from all three approaches was the most strongly concentration dependent of any GluR subtype and, except for low Ca(2+) concentrations, the values were of comparable magnitude. Thus, the three Ca(2+)-permeable GluR subtypes showed unique patterns of Ca(2+) permeability, indicating that distinct biophysical and molecular events underlie Ca(2+) influx in each subtype.
Figures


Similar articles
-
Fractional calcium currents through recombinant GluR channels of the NMDA, AMPA and kainate receptor subtypes.J Physiol. 1995 Jun 1;485 ( Pt 2)(Pt 2):403-18. doi: 10.1113/jphysiol.1995.sp020738. J Physiol. 1995. PMID: 7666365 Free PMC article.
-
Different mechanisms of Ca2+ transport in NMDA and Ca2+-permeable AMPA glutamate receptor channels.J Gen Physiol. 1998 Nov;112(5):623-36. doi: 10.1085/jgp.112.5.623. J Gen Physiol. 1998. PMID: 9806970 Free PMC article.
-
Dimensions and ion selectivity of recombinant AMPA and kainate receptor channels and their dependence on Q/R site residues.J Physiol. 1996 Oct 1;496 ( Pt 1)(Pt 1):165-73. doi: 10.1113/jphysiol.1996.sp021674. J Physiol. 1996. PMID: 8910205 Free PMC article.
-
Molecular biology of glutamate receptors.Prog Neurobiol. 1994 Feb;42(2):353-7. doi: 10.1016/0301-0082(94)90076-0. Prog Neurobiol. 1994. PMID: 8008835 Review.
-
Calcium-permeable AMPA and kainate receptors of GABAergic neurons.Biophys Rev. 2024 Apr 15;16(2):165-171. doi: 10.1007/s12551-024-01184-8. eCollection 2024 Apr. Biophys Rev. 2024. PMID: 38737208 Free PMC article. Review.
Cited by
-
Metadynamics simulations reveal mechanisms of Na+ and Ca2+ transport in two open states of the channelrhodopsin chimera, C1C2.PLoS One. 2024 Sep 6;19(9):e0309553. doi: 10.1371/journal.pone.0309553. eCollection 2024. PLoS One. 2024. PMID: 39241014 Free PMC article.
-
State-dependent changes in the electrostatic potential in the pore of a GluR channel.Biophys J. 2005 Jan;88(1):235-42. doi: 10.1529/biophysj.104.049411. Epub 2004 Oct 29. Biophys J. 2005. PMID: 15516523 Free PMC article.
-
Measurement of relative Ca²⁺ permeability during sustained activation of TRPV1 receptors.Pflugers Arch. 2016 Feb;468(2):201-11. doi: 10.1007/s00424-015-1741-1. Epub 2015 Oct 21. Pflugers Arch. 2016. PMID: 26490461
-
Glutamate excitotoxicity inflicts paranodal myelin splitting and retraction.PLoS One. 2009 Aug 20;4(8):e6705. doi: 10.1371/journal.pone.0006705. PLoS One. 2009. PMID: 19693274 Free PMC article.
-
NMDA Receptors in the Central Nervous System.Methods Mol Biol. 2017;1677:1-80. doi: 10.1007/978-1-4939-7321-7_1. Methods Mol Biol. 2017. PMID: 28986865 Free PMC article.
References
-
- Antonov SM, Gmiro VE, Johnson JW. Binding sites for permeant ions in the channel of NMDA receptors and their effects on channel block. Nature Neuroscience. 1998;1:451–461. - PubMed
-
- Bliss TVP, Collingridge GL. A synaptic model of memory: long-term potentiation in the hippocampus. Nature. 1993;361:31–39. - PubMed
-
- Burnashev N. Calcium permeability of glutamate-gated channels in the central nervous system. Current Opinion in Neurobiology. 1996;6:311–317. - PubMed
-
- Burnashev N, Monyer H, Seeburg PH, Sakmann B. Divalent ion permeability of AMPA receptor channels is dominated by the edited form of a single subunit. Neuron. 1992;8:189–198. - PubMed
Publication types
MeSH terms
Substances
Grants and funding
LinkOut - more resources
Full Text Sources
Molecular Biology Databases
Miscellaneous