. 2002 Jan 1;538(Pt 1):227-51.
doi: 10.1113/jphysiol.2001.013054.

Modulation of network behaviour by changes in variance in interneuronal properties

Affiliations

Modulation of network behaviour by changes in variance in interneuronal properties

I Aradi et al. J Physiol. .

Abstract

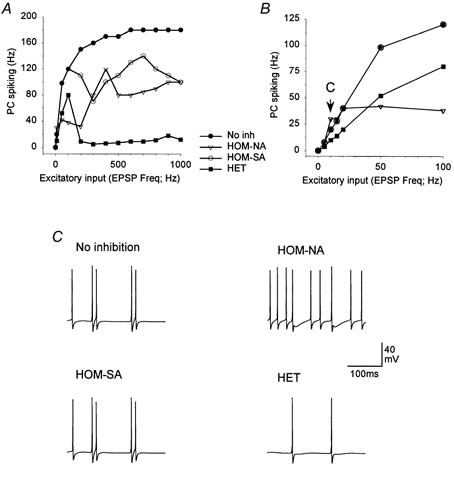
Interneurones are important regulators of neuronal networks. The conventional approach to interneurones is to focus on the mean values of various parameters. Here we tested the hypothesis that changes in the variance of interneuronal properties (e.g. in the degree of scattering of parameter values of individual cells around the population mean) may modify the behaviour of networks. Biophysically based multicompartmental models of principal cells and interneurones showed that changes in the variance in the electrophysiological and anatomical properties of interneurones significantly alter the input-output functions, rhythmicity and synchrony of principal cells, even if the mean values were unchanged. In most cases, increased heterogeneity in interneurones resulted in stronger inhibition of principal cell firing; however, there were parameter ranges where increased interneuronal variance decreased the inhibition of principal cells. Electrophysiological recordings showed that the variance in the resting membrane potential of CA1 stratum oriens interneurones persistently increased following experimental complex febrile seizures in developing rats, without a change in the mean resting membrane potential, indicating that lasting alterations in interneuronal heterogeneity can take place in real neuronal systems. These computational and experimental data demonstrate that modifications in interneuronal population variance influence the behaviour of neuronal networks, and suggest a physiological role for interneuronal diversity. Furthermore, the results indicate that interneuronal heterogeneity can change in neurological diseases, and raise the possibility that neuromodulators may act by regulating the variance of key parameters in interneuronal populations.


Figures

Figure 5
Figure 5. Variance in the frequency of excitatory inputs
A, plots of the suppression of PC spiking versus incoming EPSP frequency are shown at three levels of dispersion (d) in the frequency of the excitatory inputs to otherwise homogeneous non-adapting interneurones (see Results for details of how the dispersion was computed; note that there was no change in the mean frequency as the dispersion was increased; the input to the PCs was also dispersed). B, plot of the average suppression of PC spiking, as a function of increasing dispersion in the EPSP input frequency. Synaptic conductances used in this figure: g1 = 11 nS; g2 = 0.4 nS; g3 = 2.1 nS. The number of network simulations (1 s in duration) for this figure was 220. Furthermore, additional network simulations were carried out to explore the effects of frequency variance in the excitatory inputs to interneurones, (i) with different g1, g2 and g3 values; (ii) with (as in the figure) or without dispersion in the frequency of the excitatory inputs to the PCs; and (iii) with the random re-assignment of each individual interneurone to a particular EPSP frequency at each subsequent EPSP (as in the figure), or with the random assignment taking place only once at time zero (in the latter case, therefore, each interneurone received EPSPs at one fixed frequency throughout the simulation run; in either case, however, the mean frequency remained unchanged across the entire interneuronal population). The basic results illustrated in this figure did not change as a function of these parameter changes. The number of these additional network simulations exploring the parameter space was 1068.
Figure 11
Figure 11. Interneuronal heterogeneity and PC synchrony
Aa, schematic drawing of the circuit; Ba, Ca and Da, superimposed traces of interneurones. The interneuronal populations (HOM-NA, HET and ‘HET increased variance’) were the same as described in Fig. 9. Ab, superimposed traces from five PCs, without inputs from the interneurones (‘No inhibition’); throughout these simulations, each PC received a different amount of constant depolarizing input (in order to desynchronize the PCs). Bb, Cb and Db, superimposed traces from the PCs connected to either the homogeneous (Bb), the heterogeneous (Cb) or the ‘HET increased variance’ interneuronal population (Db). Ac (‘No inhibition’), Bc, Cc and Dc, similar to the middle row, but with the CA3 model cells of Traub et al. (1991) used as the PCs (the interneuronal populations were the same as in the rest of the figures). In this figure, the networks of Fig. 9 were used, with the following differences: the PC-PC and PC-IN connections were not included, and the Idepol excitation to the PCs was increased to produce PC spiking in the absence of interneuronal inputs. The synaptic conductances of the simulations used in the figure were: g1 = 0.6 nS; g2 = 0.2 nS; g3 = 8 nS; Idepol-PC showed a uniform distribution between 0.3 and 0.5 nA among the five PCs in the middle row; for the CA3 pyramidal cells in the bottom row, Idepol-PC was uniformly distributed between 0.2 and 0.4 nA, i.e. lower Idepol-PC amplitudes, but the same degree of dispersion, were employed; Idepol-IN: 0.15 nA; IN-IN = 7 nS. Additional simulations, with essentially similar results, were done in the following parameter ranges: Idepol-PC: 0.2–0.6 nA; g3 = 1–8 nS. The number of network simulations (1–10 s in duration) carried out in connection with the findings illustrated in this figure was 63.
Figure 9
Figure 9. Effects of interneuronal heterogeneity in firing patterns on interneuronal synchrony and subthreshold oscillations in PCs
Aa, Ba and Ca, superimposed traces from 25 interneurones illustrate that increasing heterogeneity in the interneuronal population decreases the synchrony of interneuronal firing. Ab, Bb and Cb, intracellular membrane potential oscillations indicate synchronized IPSPs in the PCs connected to the HOM-NA interneurones (in Ab). As the heterogeneity in the interneuronal population was increased, the IPSPs desynchronised (Bb and Cb). The horizontal line indicates the average membrane potential values. The insets show the corresponding fast Fourier transform (FFT) plots. Ac, Bc and Cc, effects of increased excitatory inputs to the PCs are illustrated. The networks included 25 interneurones and five PCs. Synaptic conductances were: g1 = 0.55 nS, g2 = 0.2 nS, g3 = 8 nS, PC-to-PC: 50 nS, PC-to-IN: 10 nS, IN-to-IN: 7 nS. The IN-IN coupling conductance was set to obtain gamma frequency (approximately 40 Hz) firing in the homogeneous inhibitory network. The slow muscarinic septal inputs to the PCs and INs were modelled by a steady depolarization: Idepol = 0.15 nA (‘Septum ACh’ in the inset). A mixture of 100, 200 and 500 Hz (in 1 : 1 : 1 proportion) EPSPs were arriving at the dendrites of the PCs and interneurones as background excitation. In the bottom row, the step-wise increase in excitation was produced by increasing the relative proportion of the 500 Hz component of the background excitation from 1 : 1 : 1 to 1 : 1 : 6. The HOM-NA network was the same as in previous figures (i.e. gSK = 0.03 mS cm−2; gNCa = 7 mS cm−2). The HET network did not contain the five classes used in previous simulations (i.e. NA, MA1–3, SA); instead, in this and subsequent simulations, each of the 25 interneurones in the HET network had distinct ion channel expression values between gSK = 0.08 and 0.36 mS cm−2 and between gNCa = 7 and 21 mS cm−2, with the population being distributed according to a uniform function around the mean. When the heterogeneity was further increased (as in Ca), the conductance values varied between gSK = 0.0–0.44 mS cm−2 and gNCa = 0.0–28 mS cm−2. Note that the mean conductance values (gSK = 0.22 mS cm−2 and gNCa = 14 mS cm−2) were the same in Ba and Ca. Essentially similar results could be obtained with additional simulations carried out within the following parameter ranges: depolarizing current injection to PC (Idepol-PC): 0.01–0.5 nA; g1 = 0.05–1 nS; g2 = 0.12–1.2 nS; g3 = 1.4–8 nS; PC-PC: 1.4–50 nS; Idepol-IN: 0.1–0.18 nA; PC-IN: 1–20 nS; IN-IN: 3–80 nS. Total number of network simulations carried out in connection with the results illustrated in this figure was 69.
Figure 1
Figure 1. Variance in ion channel expression in interneuronal populations influences principal cells
Aa, diagrams illustrate the simulated network. Ab, firing patterns of the interneurones (INs): NA, non-adapting; MA2, medium-adapting, type 2 (see text); SA, strongly adapting cells. All cells started at −60 mV. The current pulse (bottom drawing; 0.05 nA for 200 ms) was delivered from the resting membrane potential. The firing threshold was the same for all cell types. Ba, the PC firing rate (based on 1 s long simulations, calculated from the entire 1 s period) is plotted as a function of incoming excitation frequency, for the no-inhibition case (‘No inh’), and when the PC was connected to one of the homogeneous (HOM) interneuronal populations (NA, MA1, MA2, MA3 and SA; see text), or to the heterogeneous (HET) interneuronal population (containing an equal mixture of NA, MA1, MA2, MA3 and SA cells; in the HET case, each layer in Aa contained all five adaptation types). Synaptic conductances were g1 = 5.5 nS, g2 = 0.4 nS, g3 = 1.4 nS (g2g3 /g1 = 0.102 nS in Fig. 2A). The inset shows PC firing rates at the lowest EPSP frequencies. Bb, the firing rates of the interneurones are plotted as a function of the incoming excitation frequency. C, the PC spiking rates in the HET network did not equal the mathematical average of the PC spiking rates in the five HOM networks shown in Ba (‘heterogeneous-estimated’, HET-EST). D, superimposed traces from five interneurones from the HOM and HET networks, in response to 600 Hz EPSPs (arrow in Bb). Note the temporal dispersion of the interneuronal firing in the HET network. Since the inputs arrived synchronously in Figs 1–3, each physiological class could be simulated by a single IN projecting to all five input regions on the PC (for all simulations after Fig. 3 except for Fig. 7, the networks contained 25 individually simulated interneurones; the number of PCs was one in Figs 1–7, and five in Figs 8–11). The number of simulations (1 s) carried out for the results in this figure was 91.
Figure 2
Figure 2. Effects of variance in interneuronal ion channel expression on PC firing as a function of synaptic parameters
A-C, the effect of variance in ion channel expression levels in interneuronal populations described in Fig. 1 for one set of synaptic conductance values is shown here for a large set of parameter values. Values for g1, g2, g3: in A, g1 was varied between 5 and 25nS, while g2 = 1.2 nS and g3 = 1.5 nS were fixed; in B, g1 = 11 nS, g2 varied between 0.4 and 2 nS, g3 = 1.5 nS; in C, g1 = 11 nS, g2 = 0.4 nS, and g3 varied between 1.5 and 2.7 nS. The value of g2g3 /g1 plotted on the x-axes is a measure of the relative strengths of inhibition (g2g3) and excitation (g1) (see drawing in Fig. 1Aa). The vertical arrows point to combinations of conductance values also used in other figures: in A, for Fig. 1B: g2g3 /g1 = 0.102 nS; in B, for Fig. 4B: g2g3 /g1 = 0.153 nS; in C, for Fig. 4A: g2g3 / g1 = 0.0764 nS. The number of network simulations (1 s in duration) carried out in relation to the results illustrated in this figure was 988.
Figure 3
Figure 3. Influence of heterogeneity on the excitation of PCs by interneurones
A and B, input-output curves are shown for a PC model that includes h-channels (described in Methods; see also Chen et al. 2001). In B, the x-axis was expanded to better illustrate that the PC connected to the NA interneuronal network increased its firing rate compared with the ‘no-inhibition’ case at 10 Hz and 15 Hz input frequencies. C, representative traces of PC spiking are illustrated, in response to 10 Hz EPSPs. Further details of the simulations: Ih was included in the soma and dendrites with gh,max = 80 mS cm−2; g1 = 11 nS, g2 = 1.2 nS, g3 = 2.1 nS. Additional simulations were also carried out with amplitudes of inhibition varying between g3 = 1.4 and 2.1 nS, and the densities of h-current varying between gh,max = 60 and 150 mS cm−2; these parameter sets were examined up to 100 Hz stimulation frequencies. Increased PC firing (compared with the no-inhibition case) was found only close to parameters given here for this figure. The number of network simulations done in connection with the results illustrated in this figure was 172.
Figure 4
Figure 4. Variance in the phase of the excitatory inputs
A, C and E, input-output curves are shown for PCs (two-channel model) inhibited by homogeneous or heterogeneous interneuronal networks (HOM-NA, HOM-SA and HET), that differed in their levels of ion channel expression and firing patterns as described in Fig. 1. The EPSPs arrived either synchronously (A) or asynchronously (C). The difference between the suppression of the PC spiking after and before the introduction of phase differences in the incoming excitation is shown in E (i.e. E = CA). The insets in A and C illustrate the firing of 10 interneurones (INs) and the PC, at 100 Hz input frequency (indicated by the vertical arrows in the plots). Synaptic conductance values: g1 = 11 nS, g2 = 0.4 nS, g3 = 2.1 nS. B, D and F, similar simulations are shown as in A, C and E, but with a different set of synaptic conductance values: g1 = 11 nS, g2 = 1.2 nS, g3 = 1.4 nS. The simulations in this and the following two figures included 25 individually modelled interneurones and one PC. The total number of network simulations (1 s in duration) carried out in connection with the results illustrated in this figure was 192.
Figure 7
Figure 7. Effects of heterogeneity in interneuronal projections to PC dendrites
Aa-c, effect of spatial dispersion of inhibitory synapses along a passive cable segment. Aa,- b, IPSPs only; Ac, EPSPs and IPSPs. Aa, membrane potential changes in the middle of the cable; Ab-c, end of the cable. The inhibitory synapses were either clustered into the middle of the segment, or uniformly distributed along the cable. For the examples shown in Aa-c, the frequency of the incoming excitation to the interneuronal dendrite (and, in Ac, to the cable as well) was 600 Hz. B, average suppression of PC spiking as a function of increasing dispersion of the inhibitory synapses along the PC's middle dendritic segment. C, average suppression of PC spiking when hyperpolarizing current injections (triggered by interneuronal firing) was used, instead of synaptic conductances. Because the excitatory inputs arrived synchronously, a single, non-adapting (with gNCa,max = 7 mS cm−2, and gSK,max = 0.03 mS cm−2) interneurone was used in these simulations, which gave 150 synapses to a 200 μm long passive cable with 500 compartments (Aa-c), or to the middle segment of the PC dendrite containing 100 compartments (in B and C). This arrangement is equivalent to 150 identical (in this case, non-adapting) interneurones, each giving a single synapse and receiving synchronous excitatory inputs. The number of simulations (1 s duration) carried out for the data included in this figure was 188. In A, the synaptic conductance values were g1 = 11 nS, g2 = 0.4 nS, g3 = 1 nS; 48 additional simulations were also done with g3 = 0.5 nS. In B, the conductance values were g1 = 11 nS, g2 = 0.4 nS, g3 = 1 nS; additional 350 simulations were done with g3 changed between 0.4 and 1 nS, and with both passive and active channels included in the dendrites. In C, the synaptic conductances were g1 = 11 nS, g2 = 0.4 nS, and Ihyperpol = 30 pA; a total of 350 additional simulations were done when Ihyperpol was changed between 2 and 30pA (g1 and g2 was the same, input frequency was systematically varied from 0 to 1000 Hz). An additional 140 simulations explored the effects of anatomical heterogeneity (synaptic dispersion) when the interneurones projected to five different regions of the PC, with 30 synapses to each, and the g3 was varied between 0.2 and 0.45 nS. Similarly, additional 420 simulations were carried out when the current injection (as in C) was targeted to five input regions of the PC, 30 injection points in each region, and the Ihyperpol was varied between 2.25 and 10 pA. The general effect of spatially distributed inhibitory inputs in these additional simulations was similar to that shown in this figure. Taken together, the number of simulations done in relation to the findings illustrated in this figure was 1496.
Figure 8
Figure 8. Interneuronal heterogeneity and sudden changes in excitatory inputs
A, the spiking of the PC is illustrated, in response to varying excitation levels. The frequency of the incoming EPSPs to the network was changed in a step-wise manner, as indicated in the bottom row. The homogeneous networks included 25 NA or SA interneurones, while the heterogeneous network had 25 INs with an equal mixture of the five cell types with different action potential adaptations (as in Fig. 1). In this and subsequent simulation figures, the number of PCs was five. B, different behaviours of the PCs inhibited by homo- versus heterogeneous networks. The network included PC-to-PC collaterals. Note that the incoming excitation was stopped after the period of increased excitation (i.e. the incoming EPSP frequency was 0 Hz, as indicated in the bottom right-hand panel, and by the asterisk), but the PCs in the homogeneous networks continued to fire. In B and in Figs 9 and 10, where PC-to-PC connections were included, the neighbouring PCs were mutually coupled, and the first and the last PCs were also connected (to simulate the processes occurring in larger networks). In contrast, the interneurones were coupled in an all-to-all manner. Synaptic conductance values were: g1 = 11 nS, g2 = 1.2 nS, g3 = 1.4 nS, PC-PC = 100 nS, PC-IN = 2 nS, IN-IN = 0.2 nS. The number of network simulations (at least 1 s long) carried out in relation to the findings presented in this figure was 18, and the PC-PC connection was varied between 5 and 150 nS, and g1 was varied between 5 and 20 nS. Sustained post-excitation firing of the PCs connected to the HOM networks, with no excitation present (as in B), took place only when the PC-PC connections were strong (> 50 nS).
Figure 10
Figure 10. Influence of variance in interneuronal populations on spontaneous PC firing rates during theta-gamma oscillations
A and B, schematic diagram indicating that the interneurones in these simulations received a theta-modulated inhibitory input (four IPSPs at 40 Hz, every 200 ms), simulating the septo-hippocampal GABAergic drive specific to hippocampal interneurones. With the same synaptic connectivity values in the HOM and HET cases, the PCs in the HOM-NA network exhibited spontaneous discharges (in A), whereas the PCs connected to the HET interneuronal population (in B) remained subthreshold. C, when the HOM-NA interneurones (same as in A) received depolarizing or hyperpolarizing constant current inputs to scatter their resting membrane potentials by ± 2.5 mV, without a change in the mean resting membrane potential of the interneuronal population, the behaviour of PCs was affected (compare A and C). The synaptic conductance values were as in Fig. 9; the septal GABAergic input was 100 nS. The background excitation was a mixture of 100, 200 and 500 Hz EPSPs in 1 : 1 : 2 proportion. Additional simulations explored the parameter space, with results essentially similar to those illustrated in the figure, within the following parameter values: Idepol-PC: 0.01–0.15 nA; g1 = 0.05–10 nS at 100, 200 and 500 Hz; g2 = 0.0–1.2 nS; g3 = 1.4–8 nS; PC-PC: 1.4–5 nS; Idepol-IN: 0.15 nA; septum-GABA-IN: 0.2–300 nS; PC-IN: 1–20 nS; IN-IN: 3–80 nS. The number of network simulations carried out in connection with the findings illustrated in this figure was 86.
Figure 6
Figure 6. Effects of variance in the resting membrane potential and leak current in interneuronal populations
A, average percentage of suppression of PC spiking, as a function of increasing dispersion of the injected depolarizing or hyperpolarizing constant current into interneurones (the sum of the injected current across the interneuronal population was zero, and the injected current showed a uniform distribution). Each of the 25 inhibitory synapses along the PC's axis was driven by an interneurone that had a unique value of depolarizing or hyperpolarizing constant current input. B, the leak conductance value of interneurones was dispersed among the 25 interneurones with a uniform distribution and unchanged mean (8 × 10⁻² mS cm−2). The synaptic conductance values for the simulations shown in this figure were: g1 = 0.011 nS, g2 = 0.0004 nS, g3 = 0.0017 nS. The total number of simulations (1 s in duration) carried out in relation to the findings illustrated in this figure was 770.
Figure 12
Figure 12. Experimental evidence for altered variance in interneuronal populations in epilepsy
A, the resting membrane potentials of interneurones in the granule cell layer of the dentate gyrus show a significant depolarizing shift after a single episode of moderate concussive head trauma (Toth et al. 1997; Ross & Soltesz, 2000). Note that, in this case, only the mean value of the resting membrane potential changed significantly. Con, age-matched, sham-injured controls; Exp, experimental group (after fluid percussion head injury). The analysis of the resting membrane potential was done from samples of 20 s as described in Ross & Soltesz (2001). B, in contrast, the resting membrane potential of interneurones in the stratum oriens of the CA3 region from animals that experienced an episode of experimental prolonged febrile seizures (Exp) (Chen et al. 1999, 2001) did not show any significant alteration in the mean value of the population. However, there was a significant increase in the variance of the resting membrane potential values around the mean across the interneuronal population. In both A and B, box plots of the data are shown, illustrating the median (horizontal lines close to the middle of the shaded boxes), the 50 % of the data around the mean value (shown by the shaded boxes), and the minimum and maximum values (indicated by the vertical ‘whiskers’ sticking out from the boxes). The mean values and the population variance, together with the number of recorded interneurones (n), are shown below the box plots. Statistical analysis of the data (see Results) showed a significant (P < 0.05) change in the mean in A (with Student's t test or the Kolmogorov-Smirnov test), and a significant change in the variance in B (with the variance ratio F test).

References

    1. Ali AB, Bannister AP, Thomson AM. IPSPs elicited in CA1 pyramidal cells by putative basket cells in slices of adult rat hippocampus. European Journal of Neuroscience. 1999;11:1741–1753. - PubMed
    1. Aradi I, Holmes WR. Active dendrites regulate spatio-temporal synaptic integration in hippocampal dentate granule cells. Neurocomputing. 1999a;26:45–51.
    1. Aradi I, Holmes WR. Role of multiple calcium and calcium-dependent conductances in regulation of hippocampal dentate granule cell excitability. Journal of Computational Neuroscience. 1999b;6:215–235. - PubMed
    1. Banks MI, White JA, Pearce RA. Interactions between distinct GABAA circuits in hippocampus. Neuron. 2000;25:449–457. - PubMed
    1. Baram TZ, Gerth A, Schultz L. Febrile seizures: an appropriate-aged model suitable for long-term studies. Developmental Brain Research. 1997;98:265–270. - PMC - PubMed

Publication types

LinkOut - more resources