. 2002 Feb;76(3):968-79.
doi: 10.1128/jvi.76.3.968-979.2002.

Viral dynamics during structured treatment interruptions of chronic human immunodeficiency virus type 1 infection

Affiliations

Viral dynamics during structured treatment interruptions of chronic human immunodeficiency virus type 1 infection

Simon D W Frost et al. J Virol. 2002 Feb.

Abstract

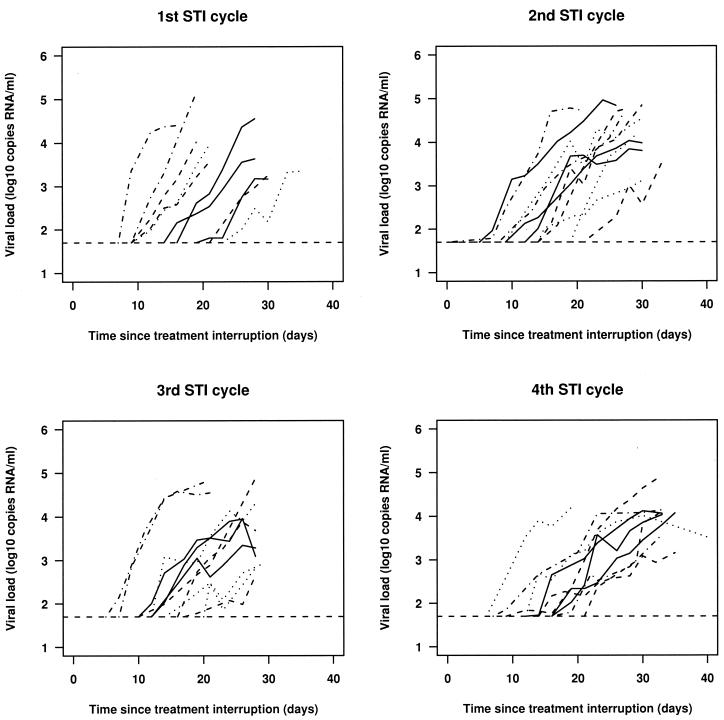
Although antiviral agents which block human immunodeficiency virus (HIV) replication can result in long-term suppression of viral loads to undetectable levels in plasma, long-term therapy fails to eradicate virus, which generally rebounds after a single treatment interruption. Multiple structured treatment interruptions (STIs) have been suggested as a possible strategy that may boost HIV-specific immune responses and control viral replication. We analyze viral dynamics during four consecutive STI cycles in 12 chronically infected patients with a history (>2 years) of viral suppression under highly active antiretroviral therapy. We fitted a simple model of viral rebound to the viral load data from each patient by using a novel statistical approach that allows us to overcome problems of estimating viral dynamics parameters when there are many viral load measurements below the limit of detection. There is an approximate halving of the average viral growth rate between the first and fourth STI cycles, yet the average time between treatment interruption and detection of viral loads in the plasma is approximately the same in the first and fourth interruptions. We hypothesize that reseeding of viral reservoirs during treatment interruptions can account for this discrepancy, although factors such as stochastic effects and the strength of HIV-specific immune responses may also affect the time to viral rebound. We also demonstrate spontaneous drops in viral load in later STIs, which reflect fluctuations in the rates of viral production and/or clearance that may be caused by a complex interaction between virus and target cells and/or immune responses.


Figures

FIG. 1.
FIG. 1.
Viral loads in plasma (expressed as log10 copies/ml of plasma) over time (in days) over four cycles of treatment interruption in 12 chronically HIV-1-infected patients. The dotted horizontal line represents the limit of detection of the viral load assay (50 copies/ml). Interruption cycles without any detectable virus are excluded.
FIG. 2.
FIG. 2.
(a) Box-and-whisker plot of the time to viral rebound, for each patient across four cycles of treatment interruption, calculated by using the average of the times of the last undetectable and the first detectable viral loads. The boxes span the second and third quartiles, and the whiskers extend to the most extreme data point that is no more than 1.5 times the interquartile range from the box. Patient 9, who showed no rebound during any of the four interruptions, is omitted. The time to viral rebound for patient 12 in the first STI cycle and patient 6 in the fourth STI cycle (when virus did not rebound during the interruption) is given conservatively by the length of the interruption. (b) Fitted values for the average viral load over time since viral rebound across four STI cycles. Estimates of the average growth rates were as follows: first cycle, 0.22 log10 copies/ml/day (0.18 to 0.26, 95% CI); second cycle, 0.16 log10 copies/ml/day (0.13 to 0.18, 95% CI); third cycle, 0.16 log10 copies/ml/day (0.13 to 0.19, 95% CI); and fourth cycle, 0.12 log10 copies/ml/day (0.09 to 0.14, 95% CI).
FIG. 3.
FIG. 3.
Viral loads in plasma (in log10 copies/ml) for each of the patients in the first interruption (○) and the fourth interruption (•) over time since viral rebound. There was no rebound in the first interruption in patient 12, and no rebound in the fourth interruption in patient 6.
FIG. 4.
FIG. 4.
Comparison of empirical estimates of the time to viral rebound with model estimates (at the top) and residual plots (at the bottom) obtained by fitting a model of exponential viral growth by using our Bayesian approach (on the left) and by using a least-squares approach (on the right). Bayesian estimates correlated well with the empirical estimates, whereas least squares gave underestimates of the time to viral rebound. Bayesian point estimates were calculated by using the median of the marginal posterior probability distribution. Negative delays (which were obtained for some interruption cycles for some patients by using least squares) were replaced by zero.
FIG. 5.
FIG. 5.
Marginal posterior probability density plot of the estimates of viral growth rate in plasma (in log10 copies/ml/day) for each patient across four cycles of treatment interruption. The rate of viral outgrowth on average decreased over successive STI cycles.
FIG. 6.
FIG. 6.
Marginal posterior probability density plot of the residual SD, representing the scatter of viral load measurements around smooth exponential growth (in log10 copies/ml) for each patient across four cycles of treatment interruption. The residual SD on average increased over successive STI cycles.
FIG. 7.
FIG. 7.
Marginal posterior probability density plot of the initial viral load as predicted assuming exponential growth throughout each interruption cycle (in log10 copies/ml) for each patient across four cycles of treatment interruption. The predicted initial viral load increased over successive STI cycles.

References

    1. Altfeld, M., and B. D. Walker. 2001. Less is more? STI in acute and chronic HIV-1 infection. Nat. Med. 7:881–884. - PubMed
    1. Bonhoeffer, S., M. Rembiszewski, G. M. Ortiz, and D. F. Nixon. 2000. Risks and benefits of structured antiretroviral drug therapy interruptions in HIV-1 infection. AIDS 14:2313–2322. - PubMed
    1. Burroughs, N. J., D. Pillay, and D. Mutimer. 1999. Significance testing of clinical data using virus dynamics models with a Markov Chain Monte Carlo method: application to emergence of lamivudine resistant hepatitis B virus. Proc. Natl. Acad. Sci. USA 266:2359–2366. - PMC - PubMed
    1. Chun, T. W., L. Stuyver, S. B. Mizell, L. A. Ehler, J. A. M. Mican, M. Baseler, A. L. Lloyd, M. A. Nowak, and A. S. Fauci. 1997. Presence of an inducible HIV-1 latent reservoir during highly active antiretroviral therapy. Proc. Natl. Acad. Sci. USA 94:13193–13197. - PMC - PubMed
    1. Chun, T. W., R. T. Davey, M. Ostrowski, J. S. Justement, D. Engel, J. I. Mullins, and A. S. Fauci. 2000. Relationship between pre-existing viral reservoirs and the re-emergence of plasma viremia after discontinuation of highly active anti-retroviral therapy. Nat. Med. 6:757–761. - PubMed

Publication types