. 2002 Feb;76(3):1293-308.
doi: 10.1128/jvi.76.3.1293-1308.2002.

Transcription regulatory sequences and mRNA expression levels in the coronavirus transmissible gastroenteritis virus

Affiliations

Transcription regulatory sequences and mRNA expression levels in the coronavirus transmissible gastroenteritis virus

Sara Alonso et al. J Virol. 2002 Feb.

Abstract

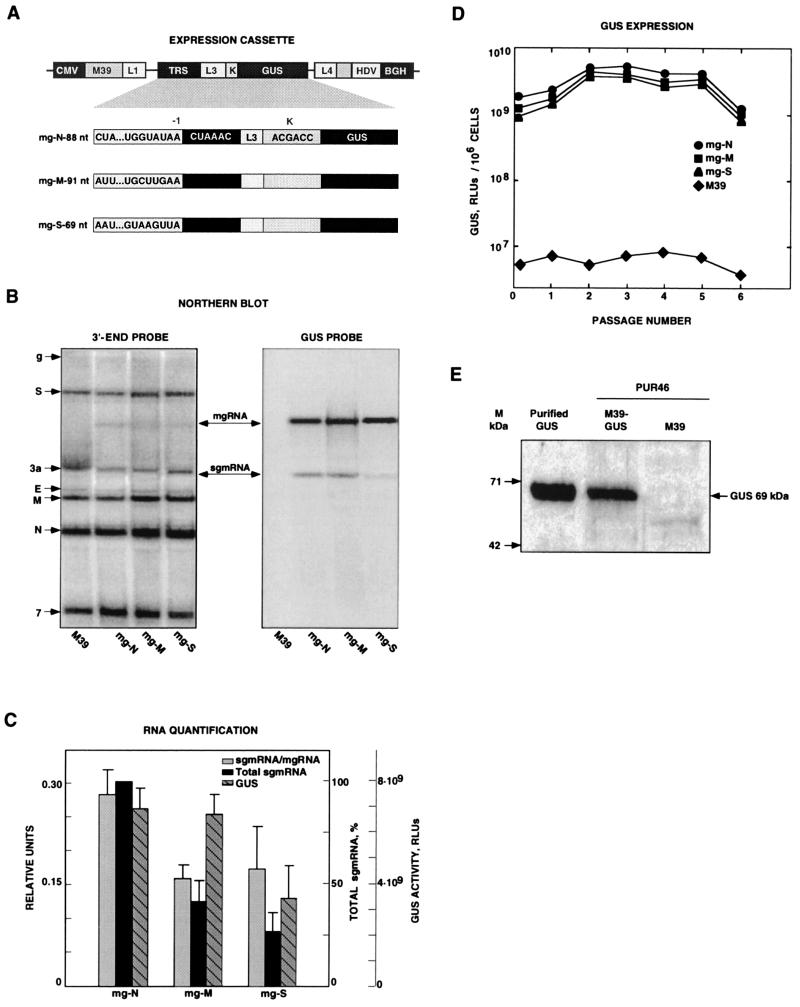
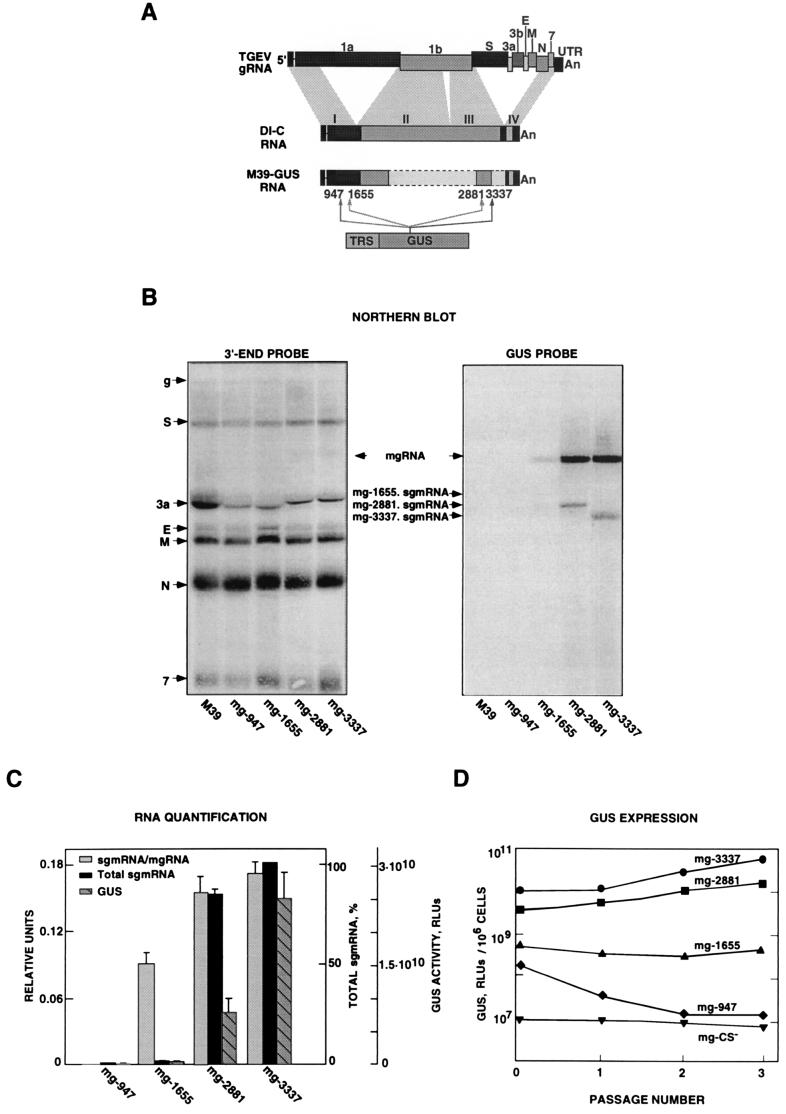
The transcription regulatory sequences (TRSs) of the coronavirus transmissible gastroenteritis virus (TGEV) have been characterized by using a helper virus-dependent expression system based on coronavirus-derived minigenomes to study the synthesis of subgenomic mRNAs. The TRSs are located at the 5' end of TGEV genes and include a highly conserved core sequence (CS), 5'-CUAAAC-3', that is essential for mediating a 100- to 1,000-fold increase in mRNA synthesis when it is located in the appropriate context. The relevant sequences contributing to TRS activity have been studied by extending the CS 5' upstream and 3' downstream. Sequences from virus genes flanking the CS influenced transcription levels from moderate (10- to 20-fold variation) to complete mRNA synthesis silencing, as shown for a canonical CS at nucleotide (nt) 120 from the initiation codon of the S gene that did not lead to the production of the corresponding mRNA. An optimized TRS has been designed comprising 88 nt from the N gene TRS, the CS, and 3 nt 3' to the M gene CS. Further extension of the 5'-flanking nucleotides (i.e., by 176 nt) decreased subgenomic RNA levels. The expression of a reporter gene (beta-glucuronidase) by using the selected TRS led to the production of 2 to 8 microg of protein per 10(6) cells. The presence of an appropriate Kozak context led to a higher level of protein expression. Virus protein levels were shown to be dependent on transcription and translation regulation.


Figures

FIG. 1.
FIG. 1.
Analysis of GUS gene transcription and expression by using minigenomes that contain different virus-derived 5′ TRSs. (A) Schematic structure of expression modules based on TGEV-derived minigenome M39 cloned under the control of the CMV immediate-early promoter (CMV). TRSs include 5′-flanking sequences derived from the TRSs of the major structural genes (N, nucleocapsid gene; M, membrane gene; S, spike gene) and the CS (5′-CUAAAC-3′). The expression cassettes located below the shaded area are flanked by L1 and L4 polylinkers. This cassette includes the TRS, an insertion site (L3), an optimized Kozak sequence (K), and the GUS gene. HDV, HDV ribozyme; BGH, BGH termination and polyadenylation signals. The designations to the left of the expression cassettes indicate the origin of each TRS and the number of nucleotides inserted. (B) Northern blot analysis of intracellular RNAs extracted at passage 2 from minigenome-transfected and TGEV-infected cells. The left and right panels show hybridizations with 3′ UTR- and GUS-specific probes, respectively. The positions of the genomic RNA (g) and mRNAs (S, 3a, E, M, N, and 7) from the helper virus are indicated to the left by their acronyms. M39 RNA overlaps mRNA 3a (first lane). mgRNAs encoding the expression cassettes with different TRSs and the mRNA for the GUS gene (sgmRNA) are indicated with arrows. (C) Quantification of RNAs detected by Northern blotting. RLUs, relative luminometric units. The data shown are the means and standard errors for three independent experiments. (D) GUS activity (per 106 cells) expressed by minigenomes encoding the GUS gene under the control of TRSs derived from the N, M, and S viral genes through six passages after transfection. Background levels are those corresponding to minigenome M39, without an insert. The data shown are averages for at least three experiments with similar results. (E) Western blot analysis of GUS expression by using TGEV-derived minigenomes. Detection of the heterologous GUS protein (69 kDa) expressed by TGEV-derived minigenome M39 (M39-GUS) was performed by Western blot analysis under reducing conditions with a GUS-specific polyclonal rabbit antiserum. Molecular masses (M) are indicated on the left. Purified GUS was used as the positive control. M39-GUS, extracts from ST cells transfected with DNA coding for minigenome mg-N-88-L2 and infected with the helper virus (PUR46-MAD), obtained at passage 4. M39, extracts from ST cells transfected with minigenome M39 and infected with the helper virus.
FIG. 2.
FIG. 2.
Influence of TRS length on transcription. (A) Schematic structures of expression modules (shown below the shaded area) based on TGEV-derived minigenome M39. The expression cassettes are flanked by L1 and L4 polylinkers. The TRS includes N gene 5′-flanking sequences of different lengths, the CS, the L3 polylinker, an optimized Kozak sequence (K), and the GUS gene. HDV, HDV ribozyme; BGH, BGH termination and polyadenylation signals. Designations to the left of the expression cassettes indicate the composition of the minigenome (mg), including the gene providing the TRS and the number of nucleotides of this TRS. (B) Northern blot analysis of intracellular RNAs extracted at passage 2 from minigenome-transfected and TGEV-infected cells. The left and right panels show hybridizations with 3′ UTR- and GUS-specific probes, respectively. The positions of the genomic RNA (g) and mRNAs (S, 3a, E, M, N, and 7) from the helper virus are indicated to the left by their acronyms. M39 RNA overlaps mRNA 3a (first lane). mgRNAs including expression cassettes with TRSs of 3, 8, 44, 88, and 176 nt from the N gene (mg-N-3, mg-N-8, mg-N-44, mg-N-88, and mg-N-176, respectively) and the mRNA for the GUS gene (sgmRNA) are indicated with arrows. (C) GUS activity (per 106 cells) expressed by the minigenomes under the control of the CS alone (mg-CS) or preceded by TRSs of different lengths from the N gene through six passages after transfection. Background levels are represented by mg-CS. RLUs, relative luminometric units. The data shown are averages for at least three experiments with similar results. (D and E) Quantification of RNAs detected by Northern blotting in passage 2, shown as the means and standard errors for three independent experiments. (D) Ratio of sgmRNA to mgRNA. (E) Total amount of mRNA. This amount was corrected by taking into account the different amounts loaded in the lanes. (F) Quantification of the expression of GUS at virus passage 2 for the experiment shown in panel C. Data are means and standard errors of the means.
FIG. 3.
FIG. 3.
Influence of 3′ TRSs on transcription, as determined by using 3′ TRSs of viral and nonviral origins. (A) Schematic structures of expression cassettes cloned into TGEV-derived minigenome M39. The TRS includes 88 nt of the 5′ TRS from the N gene preceding the CS. The sequences flanking the 3′ end of the CS are derived from viral genes (S, 3a, 3b, E, M, N, and 7) or from nonviral sequences (L2 and L3). L3 consists of 10 nt including one restriction site and an optimized Kozak sequence (K). L2 consists of 31 nt including four restriction endonuclease sites and an optimized Kozak sequence. In addition, a sequence (Ld) comprising 12 nt complementary to the 3′ end of the leader was analyzed. (B) Northern blot analysis of intracellular RNAs extracted at passage 2 from cells transfected with the indicated minigenomes and infected with TGEV. The left and right panels show Northern blot analysis with 3′ UTR- and GUS-specific probes, respectively. The positions of the genomic RNA (g) and mRNAs (S, 3a, E, M, N, and 7) from the helper virus are indicated to the left by their acronyms. M39 RNA overlaps mRNA 3a (first lane). mgRNAs encoding expression cassettes with different TRSs and the mRNA for the GUS gene (sgmRNA) are indicated with arrows. (C) Quantification of RNAs detected by Northern blotting and of GUS activity at passage 2. The data are the means and standard errors for three independent experiments. (D) GUS activity (per 106 cells) expressed by minigenomes encoding the GUS gene under the control of 3′ TRSs of viral and nonviral origins through three passages after transfection. Background levels are those observed with minigenome M39. RLUs, relative luminometric units. The data are averages for at least three experiments with similar results.
FIG. 4.
FIG. 4.
RT-PCR analysis of S gene mRNA expression. (A) Schematic diagram depicting the structure of the viral genomic RNA (gRNA) providing the position of the S gene CSs. RT-PCR was performed for the detection of sgmRNAs (mRNA S1 and mRNA S2) potentially generated from two CSs located 27 nt 5′ upstream (CS-S1) and 120 nt 3′ downstream (CS-S2) of the initiation codon of the S gene. Arrows indicate the approximate positions of the primers used for RT (gray arrow) and PCR (black arrows). The black box represents the leader sequence. (B) Analysis by electrophoresis in an agarose gel of RT-PCR products of the mRNAs produced. Lane M, molecular markers; lanes RT-PCR and PCR, bands observed after PCR amplification alone (PCR) or preceded by RT (RT-PCR).
FIG. 5.
FIG. 5.
Influence of expression cassette insertion site on transcription. (A) Diagram showing the origins in the virus genome of fragments I, II, III, and IV (shaded areas), cloned in order to assemble the cDNA encoding DI-C RNA. The bars defined by broken lines indicate the areas deleted in minigenome DI-C to obtain M39. The expression cassette comprising the TRS and the GUS gene was cloned in four different positions along minigenome M39. The TRS includes 88 nt from the 5′ TRS of the N gene, the CS, and polylinker L3 (Fig. 2). The numbers below the bars indicate the four positions (947, 1655, 2881, and 3337) where the expression cassette was inserted in relation to the first nucleotide of the minigenome. S, 3a, 3b, E, M, N, and 7 indicate the positions of the corresponding genes. An, poly(A). (B) Northern blot analysis of intracellular RNAs extracted at passage 2 from minigenome-transfected and TGEV-infected cells. The left and right panels show Northern blot analysis with 3′ UTR- and GUS-specific probes, respectively. The positions of the genomic RNA (g) and mRNAs (S, 3a, E, M, N, and 7) from the helper virus are indicated to the left by their acronyms. M39 RNA overlaps mRNA 3a (first lane). The data shown are the means and standard errors for three independent experiments. The positions of mgRNAs inserted at different positions of M39 and GUS sgmRNA are indicated by arrows. (C) Quantification of RNAs detected by Northern blotting and of GUS activity at passage 2. (D) GUS activity (per 106 cells) expressed by minigenomes including the GUS gene at different positions through three passages after transfection. Background levels are represented by minigenome mg-CS. RLUs, relative luminometric units. The data shown are averages for three experiments with similar results.

Similar articles

Cited by

References

    1. Almazán, F., J. M. González, Z. Pénzes, A. Izeta, E. Calvo, J. Plana-Durán, and L. Enjuanes. 2000. Engineering the largest RNA virus genome as an infectious bacterial artificial chromosome. Proc. Natl. Acad. Sci. USA 97:5516–5521. - PMC - PubMed
    1. Alonso, S., I. Sola, H. Wege, J. Teifke, M. Balach, J. Plana-Durán, and L. Enjuanes. Heterologous gene expression in tissue culture and in vivo using a transmissible gastroenteritis coronavirus helper dependent system. J. Gen. Virol., in press.
    1. Bronstein, I., J. J. Fortin, J. C. Voyta, R.-R. Juo, B. Edwards, C. E. M. Olenses, N. Lijam, and L. J. Kricka. 1994. Chemiluminescent reporter gene assays: sensitive detection of the GUS and SEAP gene products. BioTechniques 17:172–177. - PubMed
    1. Dubensky, T. W., D. A. Driver, J. M. Polo, B. A. Belli, E. M. Latham, C. E. Ibanez, S. Chada, D. Brumm, T. A. Banks, S. J. Mento, D. J. Jolly, and S. M. W. Chang. 1996. Sindbis virus DNA-based expression vectors: utility for in vitro and in vivo gene transfer. J. Virol. 70:508–519. - PMC - PubMed
    1. Enjuanes, L., D. Brian, D. Cavanagh, K. Holmes, M. M. C. Lai, H. Laude, P. Masters, P. Rottier, S. G. Siddell, W. J. M. Spaan, F. Taguchi, and P. Talbot. 2000. Coronaviridae, p.835–849. In M. H. V. van Regenmortel, C. M. Fauquet, D. H. L. Bishop, E. B. Carsten, M. K. Estes, S. M. Lemon, D. J. McGeoch, J. Maniloff, M. A. Mayo, C. R. Pringle, and R. B. Wickner (ed.), Virus taxonomy. Classification and nomenclature of viruses. Academic Press, Inc., New York, N.Y.

Publication types

MeSH terms