. 2002 Feb;76(3):1309-27.
doi: 10.1128/jvi.76.3.1309-1327.2002.

Relative neurotropism of a recombinant rhabdovirus expressing a green fluorescent envelope glycoprotein

Affiliations

Relative neurotropism of a recombinant rhabdovirus expressing a green fluorescent envelope glycoprotein

Anthony N van den Pol et al. J Virol. 2002 Feb.

Abstract

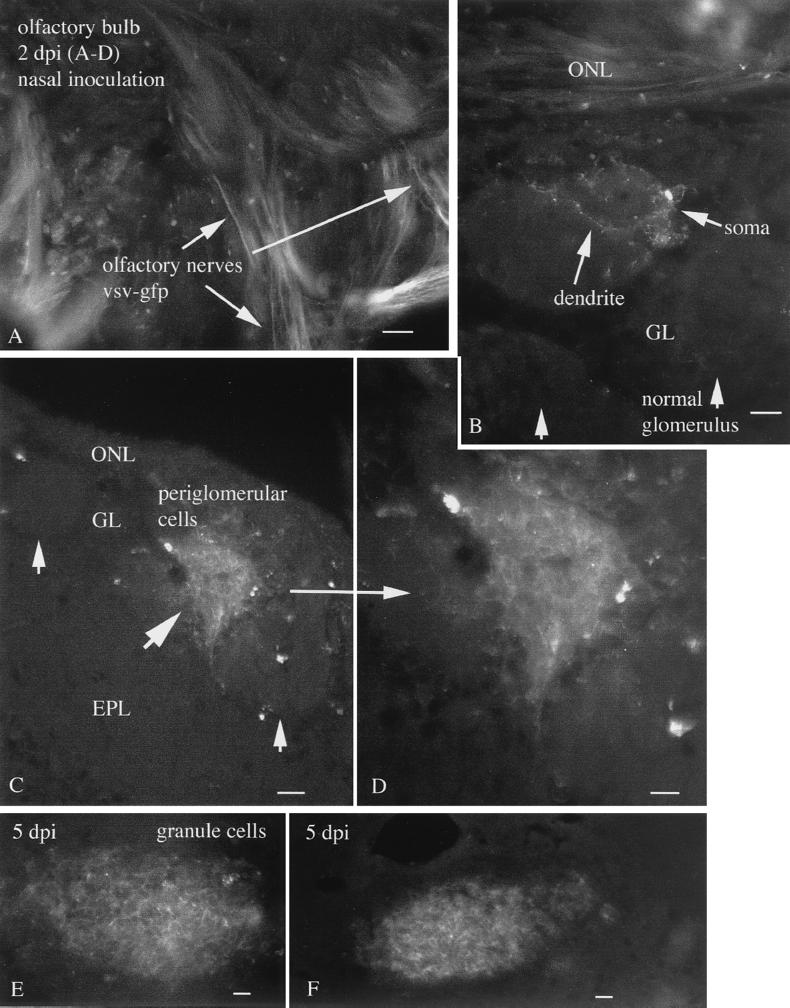
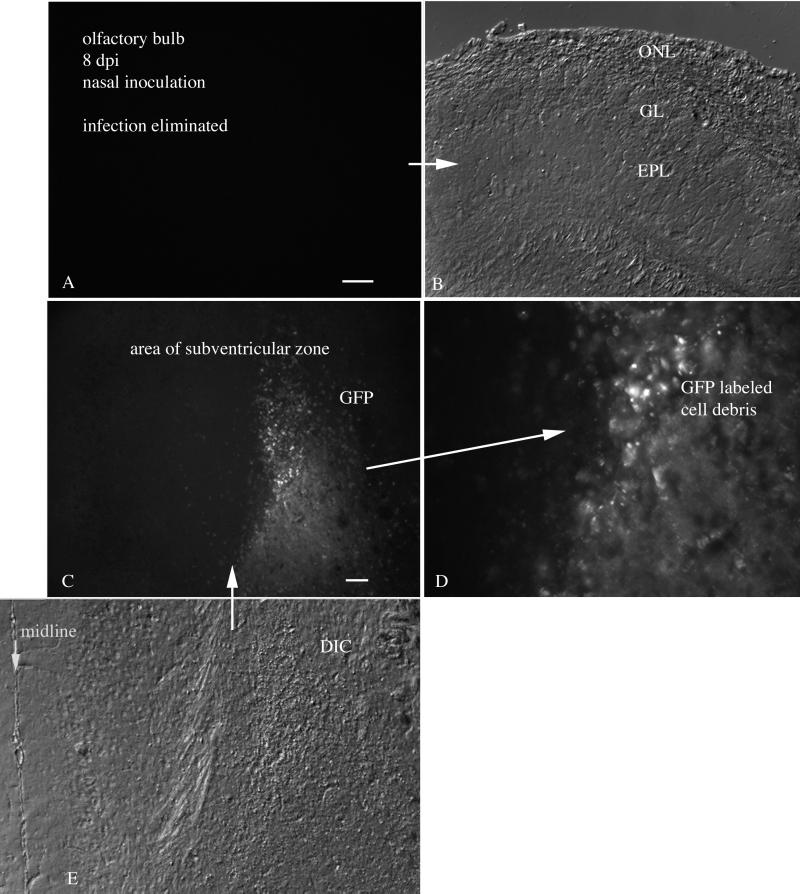
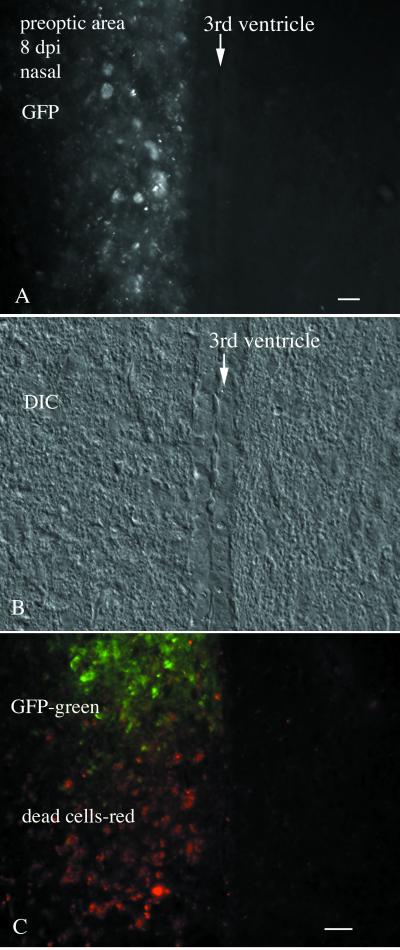
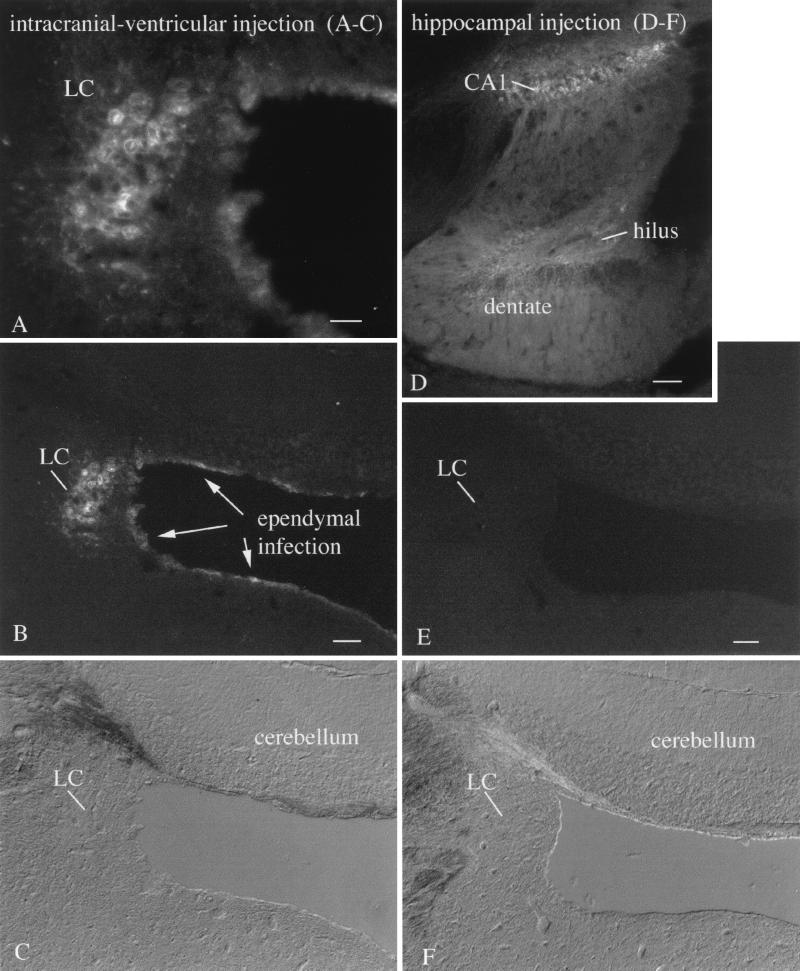
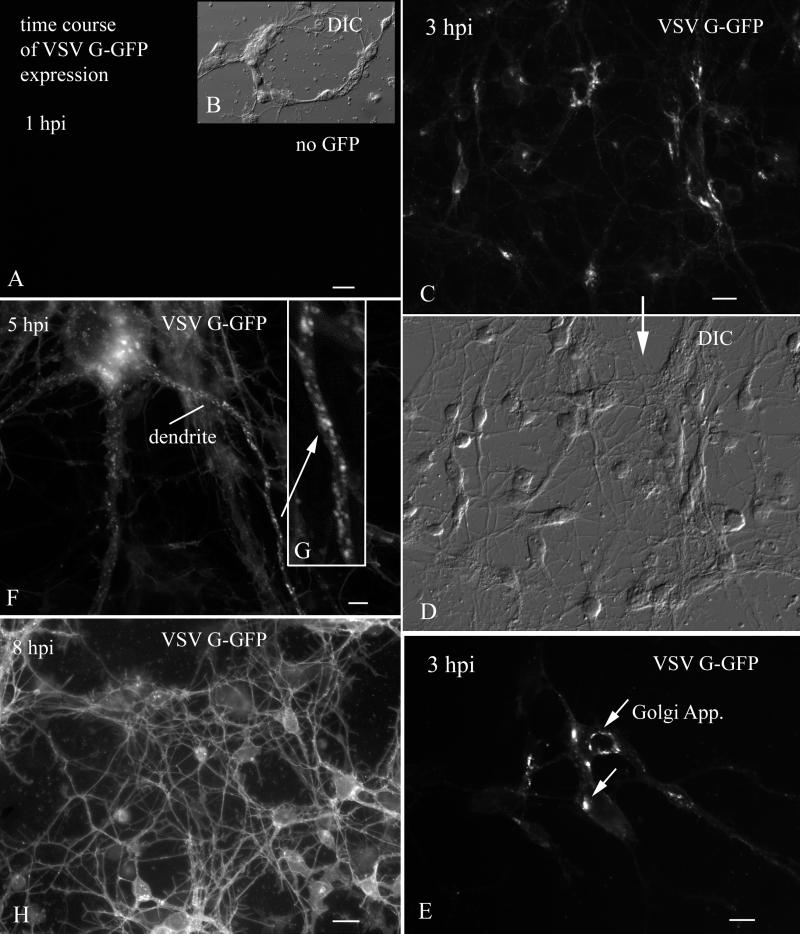
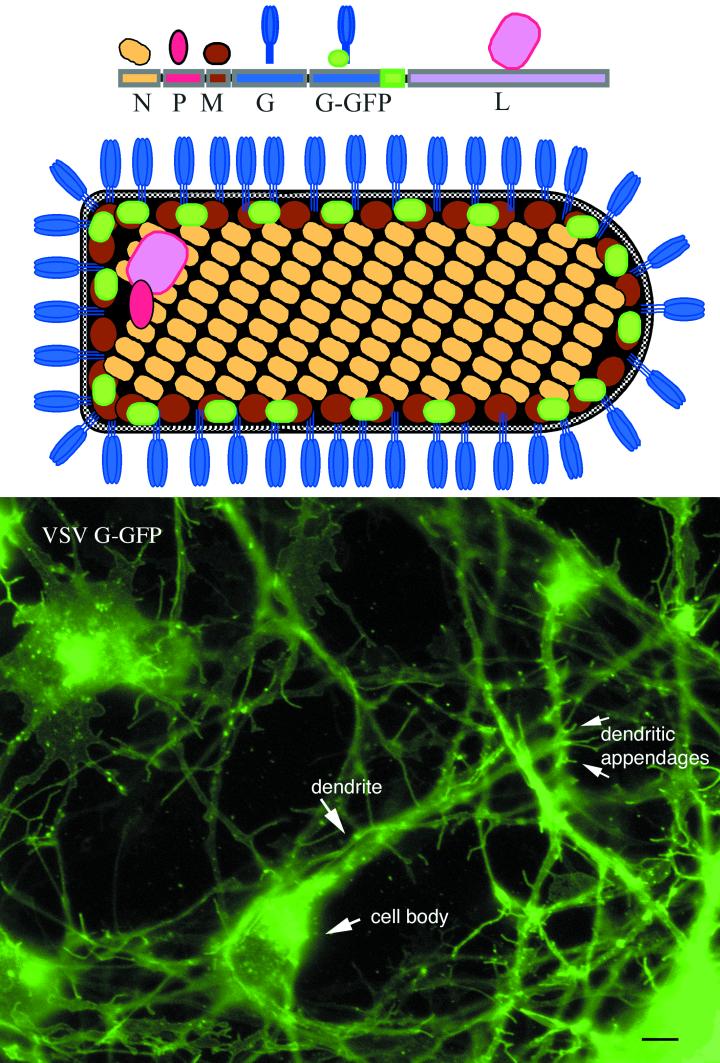
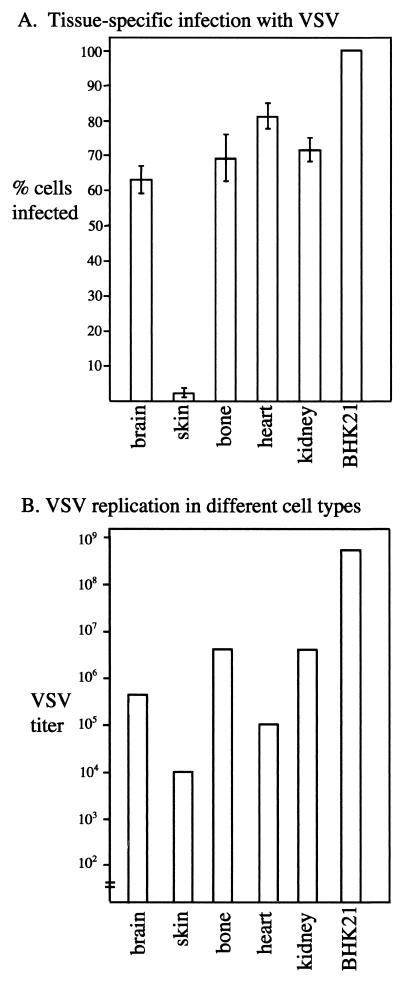
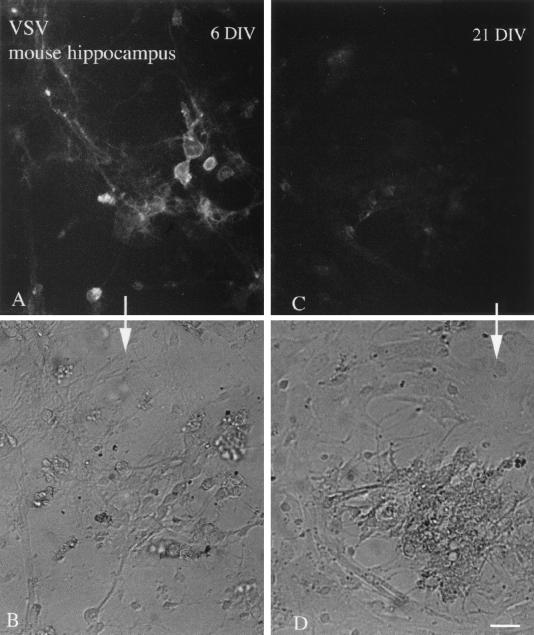
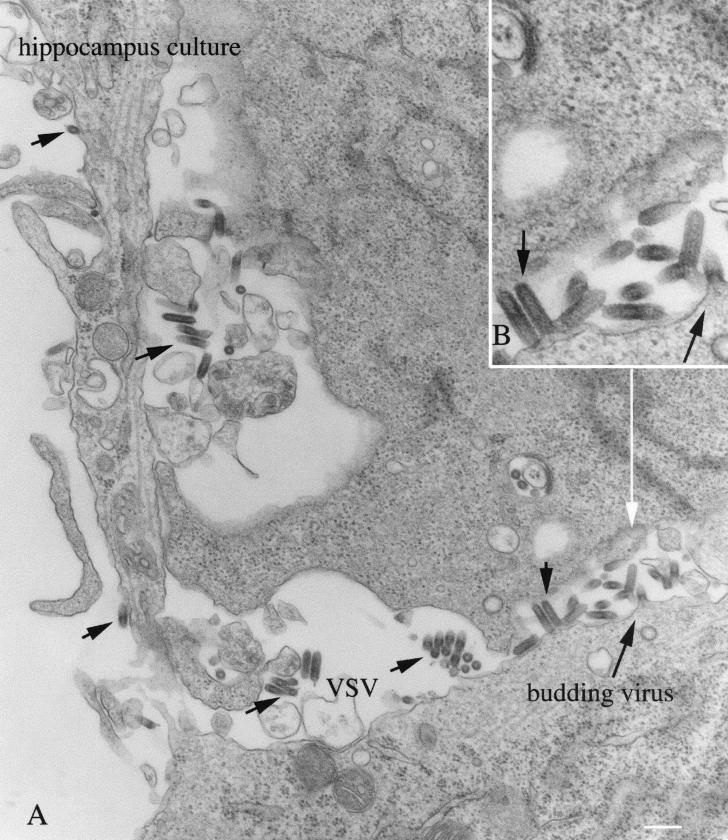
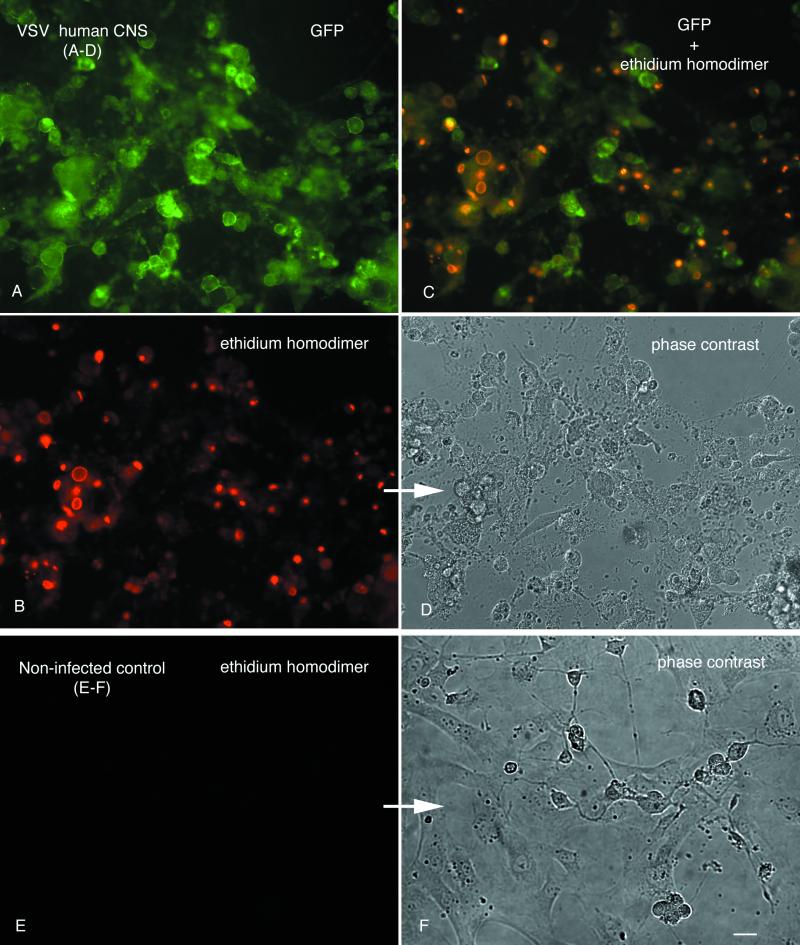
A new recombinant vesicular stomatitis virus (rVSV) that expresses green fluorescent protein (GFP) on the cytoplasmic domain of the VSV glycoprotein (G protein) was used in the mouse as a model for studying brain infections by a member of the Mononegavirales order that can cause permanent changes in behavior. After nasal administration, virus moved down the olfactory nerve, first to periglomerular cells, then past the mitral cell layer to granule cells, and finally to the subventricular zone. Eight days postinoculation, rVSV was eliminated from the olfactory bulb. Little sign of infection could be found outside the olfactory system, suggesting that anterograde or retrograde axonal transport of rVSV was an unlikely mechanism for movement of rVSV out of the bulb. When administered intracerebrally by microinjection, rVSV spread rapidly within the brain, with strong infection at the site of injection and at some specific periventricular regions of the brain, including the dorsal raphe, locus coeruleus, and midline thalamus; the ventricular system may play a key role in rapid rVSV dispersion within the brain. Thus, the lack of VSV movement out of the olfactory system was not due to the absence of potential for infections in other brain regions. In cultures of both mouse and human central nervous system (CNS) cells, rVSV inoculations resulted in productive infection, expression of the G-GFP fusion protein in the dendritic and somatic plasma membrane, and death of all neurons and glia, as detected by ethidium homodimer nuclear staining. Although considered a neurotropic virus, rVSV also infected heart, skin, and kidney cells in dispersed cultures. rVSV showed a preference for immature neurons in vitro, as shown by enhanced viral infection in developing hippocampal cultures and in the outer granule cell layer in slices of developing cerebellum. Together, these data suggest a relative affinity of rVSV for some neuronal types in the CNS, adding to our understanding of the long-lasting changes in rodent behavior found after transient VSV infection.


Figures

FIG. 1.
FIG. 1.
Nasal infection 2 to 5 days p.i. (A) Two days after nasal inoculation, VSV-GFP can be found in the olfactory nerves innervating the surface of the olfactory bulb (arrows). Scale bar, 30 μm. (B) A periglomerular cell and its dendrites show GFP fluorescence. Adjacent glomeruli show no sign of infection. Scale bar, 25 μm. (C) A single glomerulus shows strong infection, with many cells expressing GFP. Adjacent glomeruli show only a small amount of infection in one or two cells. Scale bar, 25 μm. (D) Higher magnification of panel C showing dense packing of infected periglomerular cells. Scale bar, 12 μm. (E) Near the center of the bulb, a high level of infection is found. Scale bar, 15 μm. (F) More caudally, a group of cells near the subventricular zone are infected. Scale bar, 15 μm. ONL, olfactory nerve layer; GL, glomerular layer; EPL, external plexiform layer.
FIG. 2.
FIG. 2.
Nasal infection 8 days p.i. (A) Eight days after infection, no trace of GFP remains in the olfactory bulb. (B) DIC image of the same section shown in panel A. (C) Caudal to the bulb, GFP-labeled cellular debris is found in the subventricular zone. Scale bar, 60 μm. (D) Higher magnification of panel C. (E) Aligned DIC image of the fluorescent section shown in panel C. The midline is on the left. ONL, olfactory nerve layer; GL, glomerular layer; EPL, external plexiform layer.
FIG. 3.
FIG. 3.
Nasal infection-preoptic area infiltration. (A) Cellular debris showing GFP label of the preoptic area in the single animal showing viral dispersion outside the olfactory system. Only the left side of the brain shows VSV infection of the preoptic area. In this section, no infection of the ependymal cells that line the ventricle is detected. (B) DIC image of the same field shown in panel A. (C) In a caudoventral direction in the preoptic area, GFP-labeled cells are seen at the top of the micrograph, and reddish cells indicative of degenerated cells are seen more ventrally. Scale bar, 30 μm.
FIG. 4.
FIG. 4.
Intracranial administration of VSV. Widespread infection, including substantia nigra, hypothalamus, hippocampus, and thalamus, is shown. (A) Two days after intracranial injection of VSV, cells of the pars compacta are infected with VSV. A few cells in the pars reticulata are also infected. Scale bar, 40 μm. (B) Higher magnification of the infected cells of the substantia nigra. Neurons of the medial hypothalamus (C; scale bar, 13 μm), hippocampus (D; scale bar, 20 μm), and thalamus (E and F) are infected with VSV. An inset in panel C shows dendritic spines (arrrows). (E and F) Granule appearance of VSV G-GFP in the cell body and dendrites of thalamic neurons indicative of an early stage of infection. (E) Scale bar, 6 μm. (F) Scale bar, 5 μm.
FIG. 5.
FIG. 5.
Locus coeruleus (LC) selective neurotropism. (A) After intracerebral injections of VSV into rostral brain regions where VSV was found in the ependymal cells of the ventricular system, the LC showed a high level of infection. Scale bar, 40 μm. (B) A lower magnification shows the same field, with infection of the nearby GFP-expressing ependymal cells. Other neurons also adjacent to the ventricular system show only relatively low levels of infection. The LC was infected bilaterally, but only the left LC is shown here. Scale bar, 125 μm. (C) DIC micrograph of the same area shown in panel B. (D) A small injection into the hippocampus shows infection of CA1 and the dentate gyrus and hilus. On other sections, not shown here, part of CA3 was also infected. Scale bar, 225 μm. (E) In the absence of VSV in the ventricular system, no infection of the LC is detected. Scale bar, 125 μm. (F) DIC micrograph of the same field shown in panel E.
FIG. 6.
FIG. 6.
Time course of VSV G-GFP expression after inoculation. (A) By 1 h p.i., no GFP reporter expression was detected. Scale bar, 20 μm. (B) The same field as in panel A, but with DIC. (C) At 3 h p.i., VSV G-GFP expression begins to show in the Golgi apparatus. Scale bar, 25 μm. (D) DIC image of the same field shown above in panel C. (E) High magnification of the neurons in which the primary organelle expressing GFP is the Golgi apparatus. Scale bar, 10 μm. (F) At 5 h p.i., large numbers of large vesicles containing VSV G-GFP are found in the dendrites. Scale bar, 3 μm. (G) Higher magnification of the dendrite indicated by an arrow in panel F. (H) At 8 h p.i., strong expression of VSV G-GFP is found on dendritic and somatic membranes. Scale bar, 25 μm.
FIG. 7.
FIG. 7.
VSV G-GFP in plasma membrane. This color figure depicts the rVSV genes with the added G-GFP at the top, as well as a schematic of the rVSV showing where the GFP is situated within the recombinant virus in relation to the other viral proteins. The bottom shows a CNS culture after 2 days in vitro and infected 6 h prior to imaging. At this stage of infection, heterogeneity of expression of rVSV G-GFP is found among different cells. With time, the fluorescence of all cells will increase further. Bar, 6 μm.
FIG. 8.
FIG. 8.
Multiple cell types are infected by VSV. Primary cultures were made from skin (A), brain (B), bone (C), kidney (D), and heart (E). (F) BHK-21 cells that are used to propagate the virus were used for the purpose of comparison. Cultures were fixed with paraformaldehyde 8 h p.i. The expression of VSV G-GFP is shown on the left, and the same microscope field is shown on the right side with DIC. Scale bar, 30 μm.
FIG. 9.
FIG. 9.
Bar graphs showing number of infected cells and VSV replication. (A) Tissue-specific infection with VSV. Based on the VSV infections shown in the preceding micrographs, the relative number of GFP cells (fluorescence) and total cells (DIC) was determined in eight microscope fields. Means and standard errors of the mean are shown in the top bar graph. (B) VSV replication in different cell types. To determine the rate of replication in the different cells, sister cultures were harvested (three cultures per cell type), and the viral titer was determined by incubating the culture medium with BHK-21 cells and determining the virus concentration by plaque assay. The mean level of viral replication is shown here.
FIG. 10.
FIG. 10.
Immature cultures show enhanced VSV infection. Hippocampal cultures after 6 or 21 days in vitro (DIV) were infected with VSV (106 PFU), and photomicrographs were taken at 6 h p.i. (A) A number of cells show infection indicated by the GFP fluorescence in 6 DIV cultures. (B) The same field as in panel A, shown with phase contrast. (C) Only a low level of infection was found in older cultures 21 DIV. (D) Phase-contrast image of the same field shown in panel C. Scale bar, 45 μm.
FIG. 11.
FIG. 11.
Ultrastructure of infected cultures. Hippocampal neurons were infected with VSV and fixed 8 h later. VSV can be found in the extracellular space between cells and budding from the cell body (long black arrow). VSV particles are elongated, with a bullet-shaped morphology. The ultrastructure of infected cells at this stage appears relatively normal.
FIG. 12.
FIG. 12.
Cell death of mouse CNS cells in culture. (A) GFP expression in cultures of mouse CNS. (B) Staining with ethidium homodimer reveals that most of the cells shown in panels A and C are dead. (C) Phase-contrast image of the same field, showing degenerated cells. Scale bar, 50 μm.
FIG. 13.
FIG. 13.
VSV infection of human CNS cells in culture. Panels A to D show the same microscope field, but with different types of photic excitation. (A) VSV G-GFP. (B) Ethidium homodimer stains dead cells red. (C) Combination of GFP and ethidium homodimer. Overlap of GFP green and ethidium homodimer gives an orange coloration. (D) Phase-contrast image showing cellular debris after infection. (E and F) Normal noninfected control cultures. No GFP and no ethidium homodimer staining is seen in this field, shown in phase contrast in panel F. Scale bar, 35 μm.
FIG. 14.
FIG. 14.
Enhanced infection in younger neurons in cerebellar slice. (A) Postnatal day 6 thick slices were infected with VSV (105 PFU/slice). Many cells of the developing cerebellum were infected, but the highest level of infection is found in the external granule cell layer (EGCL), a region of dividing granule cell neurons. A lower level of infection is also found in the internal granule cell layer (IGCL) and in a few cells of the Purkinje cell layer (PCL). Scale bar, 35 μm.

Similar articles

Cited by

References

    1. Andersson, T., A. K. Mohammed, B. G. Henriksson, C. Wickman, E. Norrby, M. Schultzberg, and K. Kristensson. 1993. Immunohistochemical and behaviour pharmacological analysis of rats inoculated intranasally with vesicular stomatitis virus. J. Chem. Neuroanat. 6:7–18. - PMC - PubMed
    1. Balachandran, S., and G. N. Barber. 2000. Vesicular stomatitis virus (VSV) therapy of tumors. IUBMB Life 50:135–138. - PubMed
    1. Boritz, E., J. Gerlach, J. E. Johnson, and J. K. Rose. 1999. Replication-competent rhabdoviruses with human immunodeficiency virus type 1 coats and green fluorescent protein: entry by a pH-independent pathway. J. Virol. 73:6937–6945. - PMC - PubMed
    1. Card, J. P., P. Levitt, and L. W. Enquist. 1998. Different patterns of neuronal infection after intracerebral injection of two strains of pseudorabies virus. J. Virol. 72:4434–4441. - PMC - PubMed
    1. Card, J. P., M. E. Whealy, A. K. Robbins, R. Y. Moore, and L. W. Enquist. 1991. Two alpha-herpesvirus strains are transported differentially in the rodent visual system. Neuron 6:957–969. - PubMed

Publication types

MeSH terms

Substances

LinkOut - more resources