Comparative Study
. 2001 Nov-Dec;3(6):480-8.
doi: 10.1038/sj.neo.7900204.

Imaging TCR-dependent NFAT-mediated T-cell activation with positron emission tomography in vivo

Affiliations
Comparative Study

Imaging TCR-dependent NFAT-mediated T-cell activation with positron emission tomography in vivo

V Ponomarev et al. Neoplasia. 2001 Nov-Dec.

Abstract

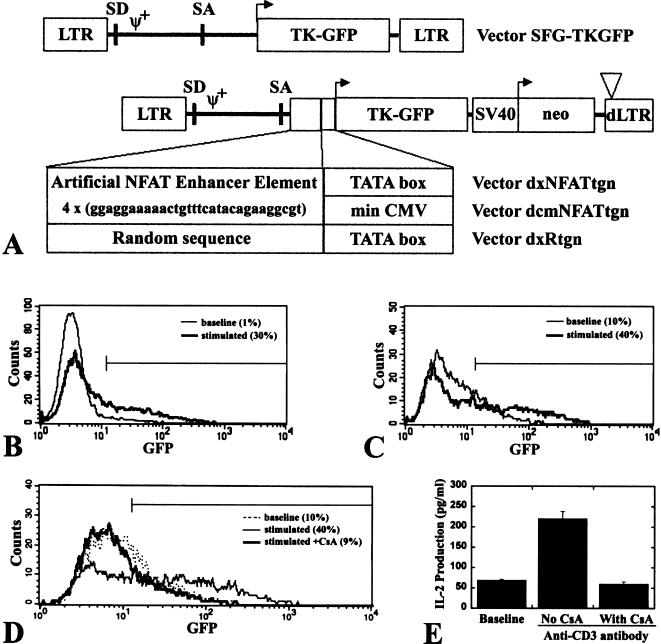
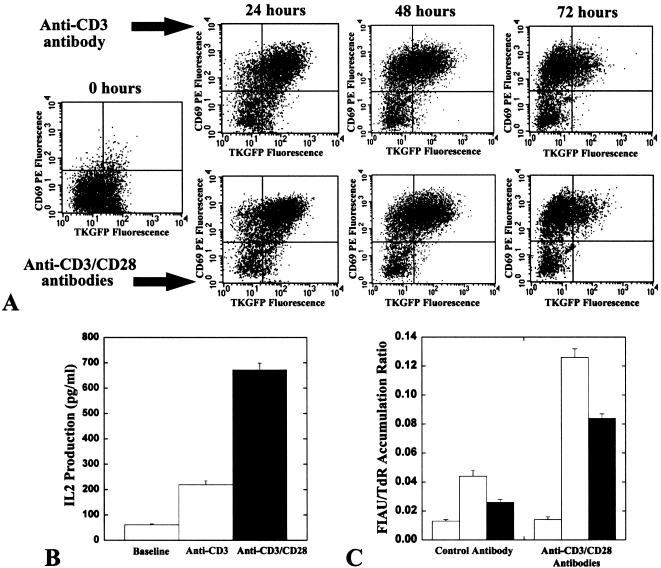
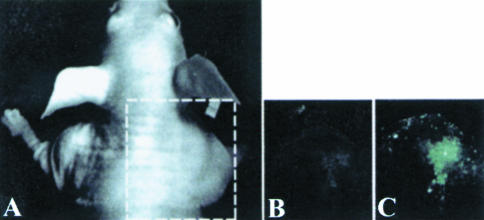
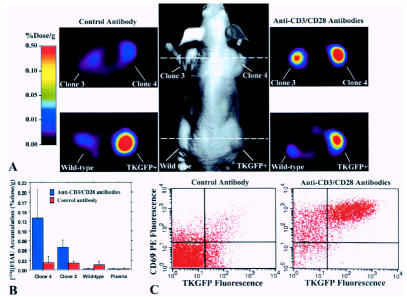
A noninvasive method for molecular imaging of T-cell activity in vivo would be of considerable value. It would aid in understanding the role of specific genes and signal transduction pathways in the course of normal and pathologic immune responses, and could elucidate temporal dynamics and immune regulation at different stages of disease and following therapy. We developed and assessed a novel method for monitoring the T-cell receptor (TCR)-dependent nuclear factor of activated T cells (NFAT)-mediated activation of T cells by optical fluorescence imaging (OFI) and positron emission tomography (PET). The herpes simplex virus type 1 thymidine kinase/green fluorescent protein [HSV1-tk/GFP (TKGFP)] dual reporter gene was used to monitor NFAT-mediated transcriptional activation in human Jurkat cells. A recombinant retrovirus bearing the NFAT-TKGFP reporter system was constructed in which the TKGFP reporter gene was placed under control of an artificial cis-acting NFAT-specific enhancer. Transduced Jurkat cells were used to establish subcutaneous infiltrates in nude rats. We demonstrated that noninvasive OFI and nuclear imaging of T-cell activation is feasible using the NFAT-TKGFP reporter system. PET imaging with [(124)I]FIAU using the NFAT-TKGFP reporter system is sufficiently sensitive to detect T-cell activation in vivo. PET images were confirmed by independent measurements of T-cell activation (e.g., CD69) and induction of GFP fluorescence. PET imaging of TCR-induced NFAT-dependent transcriptional activity may be useful in the assessment of T cell responses, T-cell-based adoptive therapies, vaccination strategies and immunosuppressive drugs.


Figures

Figure 1
Figure 1
Schematic structures and functional properties of the NFAT-TKGFP reporter systems. In SFG-TKGFP, the constitutive expression of the TKGFP reporter gene is driven by the retroviral LTR. Expression of the TKGFP reporter gene is driven by four tandem repeats of the NFAT-specific DNA binding motif linked to the minimal E1B promoter in dxNFATtgn, or linked to the minimal CMV promoter in the dcmNFATtgn vector (A). FACS profiles of TKGFP reporter gene expression (TKGFP fluorescence) under nonstimulated basal conditions (thin line) and after stimulation with anti-CD3 antibody (bold line) in mixed populations of Jurkat/dxNFATtgn (B) and dcmNFATtgn (C) cells. The basal and stimulated mean fluorescence in Jurkat/dxNFATtgn cells was 30.2 and 71.8, respectively; in dcmNFATtgn cells the values were 31.4 and 117.4, respectively; the percentage of gated (M1-GFP positive) cells is indicated in parentheses. FACS profiles of TKGFP expression (D) and ELISA measures of IL-2 expression (E) in Jurkat/dcmNFATtgn cells under nonstimulated basal conditions, after stimulation with anti-CD3 antibody, and after stimulation with anti-CD3 antibody in the presence of Cyclosporin A.
Figure 2
Figure 2
NFAT-TKGFP reporter system in dcmNFATtgn clones 3 and 4. FACS profiles of TKGFP reporter gene expression under nonstimulated basal conditions and after stimulation with anti-CD3/CD28 antibodies in clones 3 and 4 of Jurkat/dcmNFATtgn cells. The basal and stimulated mean fluorescence in clone 3 was 22.9 (A) and 351.1 (B), respectively, and in clone 4, 25.5 (C) and 419.1 (D), respectively.
Figure 3
Figure 3
The dynamics of the dcmNFATtgn reporter system response. The FACS profiles of TKGFP reporter gene and CD69 expression in Jurkat/dcmNFATtgn cells clone 4 under nonstimulated basal conditions and after continuous stimulation with anti-CD3 alone or in combination with anti-CD28 antibodies. The percentage of gated cells in each quadrant is indicated (A). IL-2 production under nonstimulated basal conditions, and after 24-hour stimulation with anti-CD3 alone or in combination with anti-CD28 (B). The radiotracer FIAU/TdR accumulation ratio before and after stimulation with anti-CD3/CD28 antibodies in Jurkat/wild type (blank), Jurkat/dcmNFATtgn clone 3 (shaded), clone 4 (solid) (C).
Figure 4
Figure 4
Optical fluorescence imaging of the NFAT-TKGFP reporter system activity in vivo. Images of TKGFP fluorescence in an s.c. Jurkat/dcmNFATtgn (clone 4) infiltrate were obtained in the same animal (A) before (B) and after treatment (C) with anti-CD3/CD28 antibodies.
Figure 5
Figure 5
Imaging NFAT-TKGFP reporter system activity with [124I]FIAU and PET and assessments in tissue samples. Photographic image of a typical mouse bearing different s.c. infiltrates (middle panel); transaxial PET images of TKGFP expression in a mouse treated with control antibody (left panel) and anti-CD3/CD28 antibodies (right panel) were obtained at the levels indicated by the dashed lines (A). [124I]FIAU accumulation (%dose/g) in tissue samples of the Jurkat/dcmNFATtgn clone 3 and 4 infiltrates, wild-type Jurkat infiltrates, and blood plasma, obtained after PET imaging (B). FACS profiles of TKGFP and CD69 expression in a tissue sample from the same Jurkat/dcmNFATtgn clone 4 infiltrate that was imaged with PET (C).

References

    1. Tjuvajev JG, Avril N, Oku T, Sasajima T, Miyagawa T, Joshi R, Safer M, Beattie B, DiResta G, Daghighian F, Augensen F, Koutcher J, Zweit J, Humm J, Larson SM, Finn R, Blasberg R. Imaging herpes virus thymidine kinase gene transfer and expression by positron emission tomography. Cancer Res. 1998;58:4333–4341. - PubMed
    1. Blasberg RG, Tjuvajev JG. Herpes simplex virus thymidine kinase as a marker/reporter gene for PET imaging of gene therapy. Q J Nucl Med. 1999;43:163–169. - PubMed
    1. Gambhir SS, Herschman HR, Cherry SR, Barrio JR, Satyamurthy N, Toyokuni T, Phelps ME, Larson SM, Balatoni J, Finn R, Sadelain M, Tjuvajev J, Blasberg R. Imaging transgene expression with radionuclide imaging technologies. Neoplasia. 2000;2:118–138. - PMC - PubMed
    1. Jacobs A, Tjuvajev JG, Dubrovin M, Akhurst T, Balatoni J, Beattie B, Joshi R, Finn R, Larson SM, Herrlinger U, Pechan PA, Chiocca EA, Breakefield XO, Blasberg RG. Positron emission tomography-based imaging of transgene expression mediated by replication-conditional, oncolytic herpes simplex virus type 1 mutant vectors in vivo. Cancer Res. 2001;61:2983–2995. - PubMed
    1. Yang M, Baranov E, Moossa AR, Penman S, Hoffman RM. Visualizing gene expression by whole-body fluorescence imaging. Proc Natl Acad Sci USA. 2000;97:12278–12282. - PMC - PubMed

Publication types

MeSH terms

LinkOut - more resources