

Hypoxia and VEGF mRNA expression in human tumors
- PMID: 11774032
- PMCID: PMC1506560
- DOI: 10.1038/sj.neo.7900195
Hypoxia and VEGF mRNA expression in human tumors
Abstract
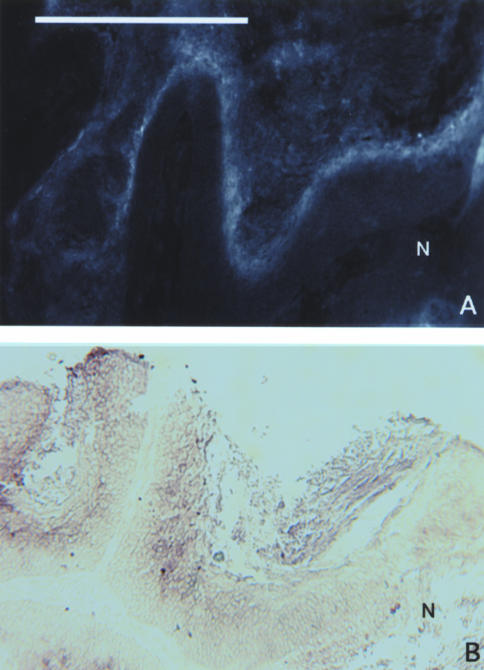
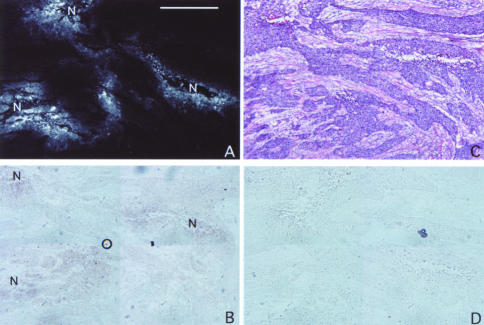
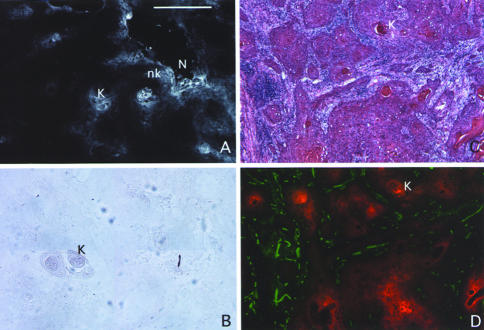
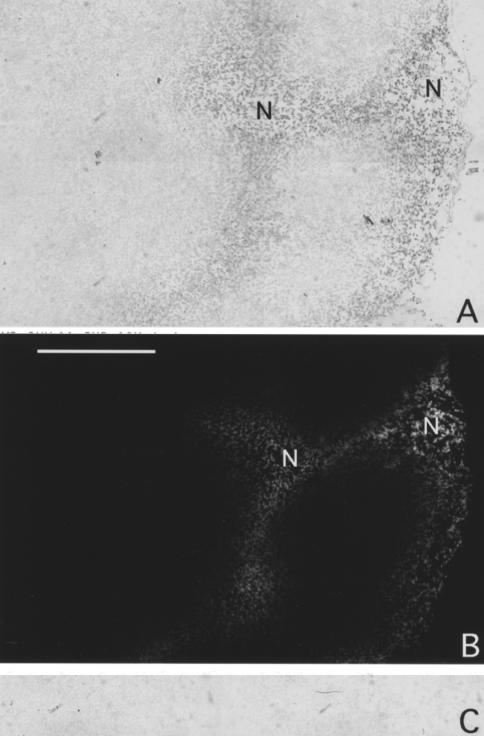
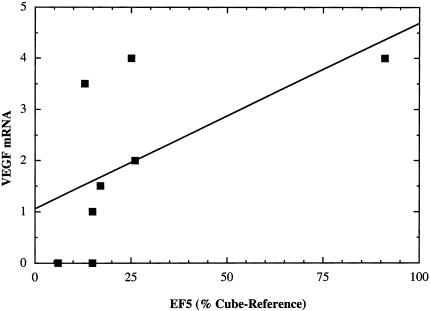
High expression of circulating plasma vascular endothelial growth factor (VEGF) in patients with cancer is an indicator of poor treatment response. Similarly, hypoxia in tumors, as measured by oxygen needle electrodes, has been found to predict for tumor-treatment failure. These two predictors may be related because hypoxia is a potent stimulator of VEGF expression in vitro. However, the demonstration of a relationship between hypoxia and VEGF in human tumors has, to date, been indirect or even negative. The purpose of this study was to test whether this unexpected result was caused by factors unique to human tumors, or whether the prior results could have been influenced by the known complexities of VEGF regulation. Therefore, we undertook a direct assessment of VEGF induction in human tumors using in situ hybridization and compared its distribution with that of hypoxia, as measured by the distribution of adducts of the hypoxia marker EF5. The distribution of both markers was assessed in relationship to the distribution of blood vessels, as measured by antibodies to CD31. Our hypothesis was that VEGF mRNA and hypoxia would colocalize, assuming that detectability of the former was not limiting. Four squamous cell carcinomas, three sarcomas and one glioblastoma multiforme were studied. When VEGF mRNA signal was detectable, its maxima colocalized with regional maxima of EF5 binding. The strongest levels of both signals were sometimes adjacent to regions of tissue necrosis. However, we were unable to predict absolute levels of EF5 binding based on absolute levels of VEGF mRNA. Conversely, for all tumors studied, regions with relatively low levels of EF5 binding had relatively low or undetectable VEGF mRNA. We found moderate EF5 binding in some keratinized cells but VEGF mRNA was not expressed by these differentiated cells. The paradigm that hypoxia and VEGF expression are linked in human tumors is supported by the data presented herein. A better understanding of the biology behind VEGF expression, including its modulation by hypoxia, is important for optimizing its use as a prognostic indicator and/or modulating its presence with biologic therapies.
Figures
Similar articles
-
Expression of vascular endothelial growth factor-b in human astrocytoma.Neuro Oncol. 2000 Apr;2(2):80-6. doi: 10.1093/neuonc/2.2.80. Neuro Oncol. 2000. PMID: 11303624 Free PMC article.
-
Coexpression of erythropoietin and vascular endothelial growth factor in nervous system tumors associated with von Hippel-Lindau tumor suppressor gene loss of function.Blood. 1998 Nov 1;92(9):3388-93. Blood. 1998. PMID: 9787178
-
Mapping of the vascular endothelial growth factor-producing hypoxic cells in multicellular tumor spheroids using a hypoxia-specific marker.Cancer Res. 1995 Dec 15;55(24):6222-6. Cancer Res. 1995. PMID: 8521417
-
eIF4E expression in tumors: its possible role in progression of malignancies.Int J Biochem Cell Biol. 1999 Jan;31(1):59-72. doi: 10.1016/s1357-2725(98)00132-0. Int J Biochem Cell Biol. 1999. PMID: 10216944 Review.
-
Hypoxia modulated gene expression: angiogenesis, metastasis and therapeutic exploitation.Eur J Cancer. 2000 Aug;36(13 Spec No):1649-60. doi: 10.1016/s0959-8049(00)00159-3. Eur J Cancer. 2000. PMID: 10959051 Review.
Cited by
-
Gene expression profiling reveals molecularly and clinically distinct subtypes of glioblastoma multiforme.Proc Natl Acad Sci U S A. 2005 Apr 19;102(16):5814-9. doi: 10.1073/pnas.0402870102. Epub 2005 Apr 12. Proc Natl Acad Sci U S A. 2005. PMID: 15827123 Free PMC article.
-
The clinical importance of assessing tumor hypoxia: relationship of tumor hypoxia to prognosis and therapeutic opportunities.Antioxid Redox Signal. 2014 Oct 1;21(10):1516-54. doi: 10.1089/ars.2013.5378. Epub 2014 May 9. Antioxid Redox Signal. 2014. PMID: 24512032 Free PMC article. Review.
-
Study on Factors Associated with High Myopia CNV in Aqueous Humor and Serum.Biomed Res Int. 2022 Apr 30;2022:8592729. doi: 10.1155/2022/8592729. eCollection 2022. Biomed Res Int. 2022. Retraction in: Biomed Res Int. 2023 Nov 29;2023:9861461. doi: 10.1155/2023/9861461. PMID: 35535041 Free PMC article. Retracted.
-
Influence of postoperative acute-phase response on angiogenesis and tumor growth: open vs. laparoscopic-assisted surgery in mice.J Gastrointest Surg. 2003 Sep-Oct;7(6):783-90. doi: 10.1016/s1091-255x(03)00111-2. J Gastrointest Surg. 2003. PMID: 13129557 Clinical Trial.
-
Invited editorial for the paper by Silvoniemi et al. "Repeatability of tumor hypoxia imaging using [18F]EF5 PET/CT in head and neck cancer." in this issue of EJNMMI.Eur J Nucl Med Mol Imaging. 2018 Feb;45(2):159-160. doi: 10.1007/s00259-017-3889-8. Eur J Nucl Med Mol Imaging. 2018. PMID: 29177538 No abstract available.
References
-
- Hockel M, Knoop C, Schlenger K, Vordran B, Baussmann E, Mitze M, Knapstein PG, Vaupel P. Intratumor pO2 predicts survival in advanced cancer of the uterine cervix. Radiother Oncol. 1993;26:45–50. - PubMed
-
- Brizel DM, Scully SP, Harrelson JM, Layfield LJ, Bean JM, Prosnitz LR, Dewhirst MW. Tissue oxygenation predicts for the likelihood of distant metastases in human soft tissue sarcoma. Cancer Res. 1996;56:941–943. - PubMed
-
- Nordsmark M, Overgaard M, Overgaard J. Pretreatment oxygenation predicts radiation response in advanced squamous cell carcinoma of the head and neck. Radiother Oncol. 1996;41:31–39. - PubMed
-
- Fyles AW, Milosevic M, Wong R, Kavanagh MC, Pintilie M, Chapman W, Levin W, Manchul L, Keane TJ, Hill RP. Oxygenation predicts radiation response and survival in patients with cervix cancer. Radiother Oncol. 1998;48:149–156. - PubMed
-
- Moulder JE, Rockwell SC. Tumor hypoxia: its impact on cancer therapy. Cancer Metastasis Rev. 1987;5:313–341. - PubMed
Publication types
MeSH terms
Substances
Grants and funding
LinkOut - more resources
Full Text Sources