. 2002 Jan 7;156(1):137-48.
doi: 10.1083/jcb.200105140. Epub 2002 Jan 3.

Fyn tyrosine kinase is a downstream mediator of Rho/PRK2 function in keratinocyte cell-cell adhesion

Affiliations

Fyn tyrosine kinase is a downstream mediator of Rho/PRK2 function in keratinocyte cell-cell adhesion

Enzo Calautti et al. J Cell Biol. .

Abstract

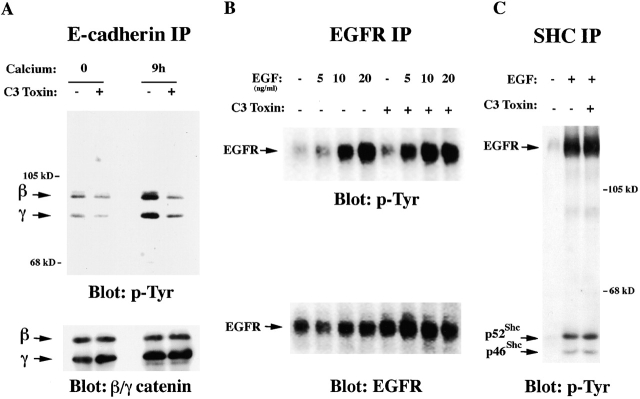
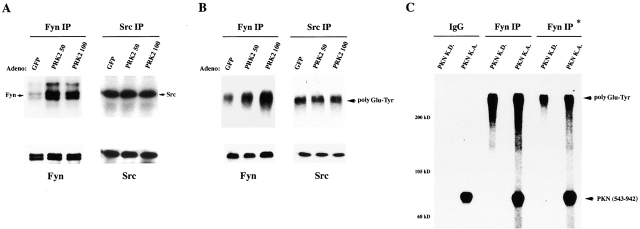
The Rho GTPase and Fyn tyrosine kinase have been implicated previously in positive control of keratinocyte cell-cell adhesion. Here, we show that Rho and Fyn operate along the same signaling pathway. Endogenous Rho activity increases in differentiating keratinocytes and is required for both Fyn kinase activation and increased tyrosine phosphorylation of beta- and gamma-catenin, which is associated with the establishment of keratinocyte cell-cell adhesion. Conversely, expression of constitutive active Rho is sufficient to promote cell-cell adhesion through a tyrosine kinase- and Fyn-dependent mechanism, trigger Fyn kinase activation, and induce tyrosine phosphorylation of beta- and gamma-catenin and p120ctn. The positive effects of activated Rho on cell-cell adhesion are not induced by an activated Rho mutant with defective binding to the serine/threonine PRK2/PKN kinases. Endogenous PRK2 kinase activity increases with keratinocyte differentiation, and, like activated Rho, increased PRK2 activity promotes keratinocyte cell-cell adhesion and induces tyrosine phosphorylation of beta- and gamma-catenin and Fyn kinase activation. Thus, these findings reveal a novel role of Fyn as a downstream mediator of Rho in control of keratinocyte cell-cell adhesion and implicate the PRK2 kinase, a direct Rho effector, as a link between Rho and Fyn activation.


Figures

Figure 1.
Figure 1.
Endogenous Rho activity increases in calcium-induced keratinocyte differentiation. (A) Total cell extracts from mouse primary keratinocytes under low calcium conditions and at various times of calcium exposure were incubated with beads coupled to the Rho-binding domain of rhotekin, which binds specifically to activated Rho. Pull-down assays were analyzed by 12.5% SDS-PAGE and immunoblotting with antibodies against RhoA (top), alongside corresponding total cell extracts, for normalization of total RhoA protein levels (bottom). The results of two independent experiments are shown. (B) Densitometric scanning of the autoradiographs was used to determine relative levels of RhoA activation versus protein amounts. Average Rho activation from three independent experiments, including the ones shown in A, was calculated. Bars refer to value variation among experiments. (C) Keratinocytes under low calcium conditions and at 2 and 9 h of high calcium exposure were fixed in 4% paraformaldehyde and processed for immunofluorescence with anti–Rho A polyclonal antibodies and FITC-conjugated secondaries. Samples were analyzed by confocal microscopy using the same light exposure and image capture conditions. Arrows point to areas of cell–cell contacts in calcium-treated keratinocytes with detectable Rho-specific signal. Bar, 20 μm.
Figure 2.
Figure 2.
Endogenous Rho activity is required for recruitment of E-cadherin and tyrosine-phosphorylated proteins at cell–cell borders. Keratinocytes were pretreated with a GST-C3 fusion protein (bottom) or GST control (top) for 1.5 h and either exposed to 2 mM CaCl2 (High Ca2+) for 9 h or kept in medium at low calcium concentrations (0.05 mM) (Low Ca2+). Cells were briefly preextracted in 0.2% Triton CSK buffer before paraformaldehyde fixation and double stained with E-cadherin–specific monoclonal antibodies followed by Texas red– conjugated secondary antibodies (red) and with FITC-conjugated antiphosphotyrosine antibodies (green). A similar pattern of staining was obtained without preextraction procedure. Samples were analyzed by confocal microscopy using same light exposure and image capture conditions, and green and red images (small panels) were superimposed; sites of overlapping staining are visualized as yellow (large panels). Each image is the projection of eight focal planes spanning the whole depth of the culture (0.8 μm between individual plans). Note that some cell–cell borders stain only weakly with antiphosphotyrosine antibodies. These correspond to immature borders at the zipper stage as can be visualized at higher magnification. Bar: (large panels) 15 μm; (small panels) 33 μm. Similar results were obtained in two other experiments.
Figure 3.
Figure 3.
Endogenous Rho activity is required for tyrosine phosphorylation of β- and γ-catenin in response to increased extracellular calcium. (A) Keratinocytes were pretreated for 1.5 h with either GST-C3 (+) or GST control proteins (−) and exposed to 2 mM CaCl2 for 9 h or maintained under low calcium conditions (0). Cell lysates were immunoprecipitated with anti–E-cadherin antibodies followed by immunoblotting with antibodies against phosphotyrosine or β- and γ-catenin as indicated. (B) Keratinocytes in low calcium medium were serum-starved for 18 h and then pretreated for 1.5 h with either GST-C3 (+) or GST proteins (−). Cells were stimulated for 10 min with EGF at the indicated concentrations followed by immunoprecipitation with antibodies against the EGF receptor (EGFR) and immunoblotting with the same antibodies or antibodies against phosphotyrosine as indicated. (C) Keratinocytes were treated as in B followed by immunoprecipitation with antibodies against SHC and immunoblotting with antiphosphotyrosine antibodies. The position of the p46 and p52 isoforms of SHC and of the EGF receptor are indicated.
Figure 4.
Figure 4.
Constitutively active Rho promotes keratinocyte cell–cell adhesion by a tyrosine kinase-dependent mechanism. Keratinocytes were infected with a control adenovirus expressing the GFP and β-gal proteins (AdGFP–β-gal) or an adenovirus expressing a constitutively active RhoA mutant together with GFP (AdRhoV14). Cells were kept in low calcium medium (0) or exposed to high calcium for the last 2 h (2 h) before termination of the experiment (48 h after infection). Parallel experiments were performed with cells pretreated with the tyrosine kinase inhibitor Genistein (100 μM) for 1 h before calcium exposure (2 h + Gen). 48 h after infection, samples were briefly preextracted with 0.2% Triton CSK buffer, fixed in paraformaldehyde, and stained with E-cadherin–specific antibodies followed by Texas red–conjugated secondary antibodies. The higher E-cadherin signal in RhoV14-expressing cells is due to increased association of E-cadherin with Triton-insoluble cell–cell adhesion structures, since RhoV14 expression causes no increase in E-cadherin expression levels (unpublished data). Samples were analyzed by confocal microscopy using the same light exposure and image capture conditions. Images result from the projection of eight focal plans. Similar results were obtained in three other experiments. Bar, 15 μm.
Figure 5.
Figure 5.
Quantitative measurement of keratinocyte cell–cell adhesion as a function of RhoV14 expression and tyrosine phosphorylation. (A) Triplicate samples of primary keratinocytes infected with control (AdGFP–β-gal; white bars) or RhoV14-expressing (AdRhoV14; black bars) adenoviruses were kept under low calcium conditions (Low Ca2+) or treated with calcium for 3 or 9 h. Data are expressed as the percentage of single cells released by mechanical disruption after dispase treatment versus total number of cells recovered after subsequent treatment of the same samples with trypsin. The difference in single cell release from the RhoV14-expressing keratinocytes versus same cells treated with Genistein was found to be statistically significant (P < 0.004) as assessed by Kruskall-Wallis test. (B) A similar assay was performed with adenovirus-infected keratinocytes under low calcium conditions or incubated with calcium for 3 h in the absence or the presence of Genistein (100 μM), PP1 (5 μM), or AG1478 (5 μM). Inhibitors were added to the medium 12 h after adenovirus infection, and cells were kept in low calcium medium or exposed to 2 mM CaCl2 for the last 3 h before termination of the experiment (48 h after infection).
Figure 6.
Figure 6.
Activated Rho induces tyrosine phosphorylation of β- and γ-catenin and p120 ctn . (A) Keratinocytes were infected with the control AdGFP–β-gal or AdRhoV14 adenoviruses and kept in low calcium medium (0) or exposed to 2 mM CaCl2 for the last 9 h (9 h) before termination of the experiment (48 h after infection). Cell extracts were immunoprecipitated with antibodies against E-cadherin, and the immune complexes were analyzed by sequential immunoblotting with antibodies against phosphotyrosine, E-cadherin, β-catenin, and γ-catenin as indicated. The slight increase in total levels of γ-catenin in the RhoV14-expressing keratinocytes was not reproducibly observed in other experiments (for instance in C). (B) Extracts from keratinocytes infected with the AdGFP–β-gal and AdRhoV14 adenoviruses were immunoprecipitated with antibodies against β-catenin (top) or p120ctn (bottom) followed by sequential immunoblotting with antibodies against phosphotyrosine and the corresponding proteins as indicated. The β-catenin immunoprecipitates were derived from keratinocytes under low calcium conditions infected with adenoviruses at two different multiplicity of infection (moi). The p120ctn immunoprecipitates were from adenovirally infected keratinocytes with or without calcium treatment for 9 h. The slightly lower levels of p120ctn tyrosine phosphorylation in the RhoV14-expressing keratinocytes after calcium treatment were not seen in other experiments. (C) Keratinocytes were pretreated for 1.5 h with either solvent alone (−) or 1 μM cytochalasin D (CD; +) and either kept in low calcium medium (0) or exposed to 2 mM CaCl2 for 9 or 24 h. Cell lysates were immunoprecipitated with E-cadherin–specific antibodies followed by immunoblotting with antibodies against phosphotyrosine and β- and γ-catenin as indicated. (D) Keratinocytes were infected with either the AdGFP–β-gal or AdRhoV14 adenoviruses and either untreated (−) or treated with 1 μM cytochalasin D (CD) 12 or 24 h before termination of the experiment (48 h after infection). Cell lysates were analyzed as in C. Preliminary experiments showed that the indicated concentration and time of cytocalasin D treatment was sufficient to totally disrupt actin cables (as visualized by FITC-conjugated phalloidin) without affecting cell viability or AdRhoV14 expression.
Figure 7.
Figure 7.
Constitutively active Rho promotes recruitment of p120 ctn to cell–cell adhesions in a tyrosine kinase-dependent manner. Keratinocytes were infected with AdGFP–β-gal or AdRhoV14 adenoviruses and exposed to high calcium concentrations for the last 2 h (2 h) before termination of the experiment (48 h after infection) (top). Parallel experiments were performed with cells pretreated with the tyrosine kinase inhibitor Genistein (100 μM) for 1 h before calcium exposure (2 h Ca++ + Gen) (bottom). Samples were processed for immunofluorescence analysis with anti-p120ctn antibodies and FITC-conjugated secondaries as in the legend to Figs. 2 and 4. Samples were analyzed by confocal microscopy using same light exposure and image capture conditions. Images result from the projection of eight focal plans. Parallel analysis of keratinocytes under low calcium conditions and at 9 h of calcium treatment yielded a pattern of staining for p120ctn similar to that observed for E cadherin (as shown in Fig. 4). Bar, 20 μm.
Figure 8.
Figure 8.
Rho activity is both required and sufficient for induction of Fyn tyrosine kinase activity. (A) Keratinocytes were pretreated for 1.5 h with either the GST-C3 (+) or GST proteins (−). Cells were maintained under low calcium conditions or exposed to 2 mM CaCl2 for the indicated times and immunoprecipitated with Fyn-specific antibodies or nonimmune IgG (N.I.) control. Half of the immune complexes were processed for in vitro kinase assay with [γ-32P]ATP without exogenous substrate (top) and half analyzed by immunoblotting with anti-Fyn antibodies (bottom). Positions of Fyn and IgG heavy chains are indicated. Densitometric scanning of the autoradiographs after normalization for Fyn protein amounts indicated that Fyn activity as measured by the autophosphorylation signal was induced 3.6-fold in control cells after 6 and 9 h of calcium treatment, whereas in the C3-pretreated cells Fyn activity increased only 1.2-fold after calcium exposure. (B) Keratinocytes infected with control AdGFP–β-gal and AdRhoV14 adenoviruses were immunoprecipitated with anti-Fyn or anti-Src antibodies or with nonimmune rabbit IgGs (N.I.) as indicated. Half of the immune complexes were subjected to in vitro kinase assays with [γ-32P]ATP and enolase as exogenous substrate (top); half of the immune complexes were processed for immunoblotting with Src- or Fyn-specific antibodies (bottom). The enolase bands were excised from the gel, and their 32P content was determined by direct scintillation counting and normalized for kinase protein amounts as determined by densitometric scanning of the immunoblots. The ratio of Fyn kinase activity in Rho-expressing versus control keratinocytes was 3.2, whereas the ratio of Src kinase activity was 1.2. Similar results were obtained in three other experiments.
Figure 9.
Figure 9.
Increased catenin tyrosine phosphorylation by activated Rho is mediated by Fyn/Src kinases. (A) Keratinocytes were infected for 48 h with the AdGFP–β-gal or AdRhoV14 adenoviruses. 12 h after infection, cells were treated with solvent alone (−) or with the AG1478 or PP1 inhibitors at the indicated concentrations. Cell extracts were immunoprecipitated with antibodies against E-cadherin followed by immunoblotting with antibodies against phosphotyrosine and β- and γ-catenin as indicated. (B) Primary keratinocytes derived from fyn−/ and fyn+/ + mice were infected with control AdGFP–β-gal or AdRhoV14 adenoviruses at an moi of 25 and 50 (Rho 25 and Rho 50, respectively). Cell lysates were analyzed as in A. (C) Keratinocytes from fyn−/ and fyn+/ + mice were infected with AdGFP–β-gal and AdRhoV14 adenoviruses and immunoprecipitated with antibodies against p120ctn followed by immunoblotting with the same antibodies or antibodies against phosphotyrosine as indicated. (D) Keratinocytes from fyn−/ and fyn+/ + mice were infected with AdGFP–β-gal and AdRhoV14 adenoviruses as above and immuno-precipitated with antibodies against Fyn or Src followed by in vitro kinase assays without exogenous substrates. The graph shows quantification of Fyn and Src activity as determined by densitometric scanning of the autophosphorylation signal after normalization for protein amounts. Similar results were observed by in vitro kinase assays in the presence of enolase as exogenous substrate (unpublished data).
Figure 10.
Figure 10.
The enhanced recruitment of E-cadherin to cell–cell adhesions by activated Rho is dependent on PRK2/PKN binding. (A) Primary keratinocytes were transfected with plasmid vectors concomitantly expressing GFP for identification of transfected cells and activated RhoV14 (left) or the RhoV14-Y42C mutant (right). 2 d after transfection, cultures were treated with calcium for 2 h before fixation and processed for immunofluorescence with anti–E-cadherin antibodies and rhodamine red–coupled secondaries. Samples were analyzed by confocal microscopy using same image capture conditions. Images are representative of two independent experiments in which a minimum of 20–30 transfected cells were analyzed for each condition. (B) Keratinocytes transfected with the same vectors as in A and maintained under low calcium conditions were processed for immunofluorescence with antivinculin antibodies for focal adhesion visualization. (C) HeLa cells were transfected with the same vectors as in A and B and analyzed by immunoblotting with antibodies against the myc-tagged Rho proteins. Bar, 20 μm.
Figure 11.
Figure 11.
Endogenous PRK2 activity increases with keratinocyte differentiation. (A) Total cell extracts from keratinocytes under low calcium conditions (0) and at various times of high calcium exposure were immunoprecipitated with antibodies against PRK2 or nonimmune IgG control (−) and processed for in vitro autophosphorylation kinase assay with [γ-32P]ATP. Half of the immune complexes were analyzed by immunoblotting with anti-PRK2 antibodies for normalization of kinase amounts (bottom). The results of three independent experiments are shown. Experiment 3 includes a parallel analysis of keratinocytes infected for 48 h with the AdGFP–β-gal and AdRhoV14 adenoviruses. (B) Results were quantified by densitometric scanning of the autoradiographs and normalized for PRK2 protein amounts. Values are expressed as arbitrary units of kinase activity relative to basal levels in keratinocytes under low calcium conditions. Average values of PRK2 kinase activity from the three experiments shown in A were calculated. Bars refer to variation in relative kinase activity at the same time points among different experiments. (C) Total cell extracts from mouse primary keratinocytes under low calcium conditions (0) and at various times of high calcium exposure were immunoprecipitated with antibodies against PKN or nonimmune IgG control (−) and processed for in vitro autophosphorylation kinase assay with [γ-32P]ATP. Half of the immune complexes were analyzed by immunoblotting with anti-PRK2 antibodies for normalization of protein amounts (bottom). By densitometric scanning of the autoradiographs and normalization for PKN protein amounts, PKN kinase activity was found to increase 1.8- and 1.5-fold at 1 and 2 h of calcium treatment, respectively, returning to basal levels thereafter.
Figure 12.
Figure 12.
Increased PRK2 activity promotes establishment of keratinocyte cell–cell adhesion. (A) Keratinocytes were infected with either AdGFP–β-gal– or a PRK2-expressing adenovirus at 25 (AdPRK2 25) or 50 moi (AdPRK2 50). 48 h after infection cell extracts were analyzed by 7.5% SDS-PAGE and immunoblotting with anti-PRK2 antibodies. The position of the PRK2 protein is indicated. Densitometric analysis of the autoradiograph revealed an increase of 3.7- and 6-fold in PRK2 expression in cells infected with AdPRK2 at a 25 and 50 moi, respectively, relative to cells infected with the AdGFP–β-gal virus. (B) Keratinocytes infected with the AdGFP–β-gal and AdPRK2 adenoviruses were exposed to high calcium concentrations for 2 h before termination of the experiment (48 h after infection). Samples were processed for immunofluorescence analysis with anti–E-cadherin antibodies and rhodamine red–conjugated secondaries and analyzed by confocal microscopy using the same light exposure and image capture conditions. Each image is the projection of eight focal plans. 1 and 2 refer to images derived from two independent experiments. (C) Triplicate dishes of keratinocytes infected with AdGFP–β-gal (white bars) or AdPRK2 (black bars) adenoviruses for 48 h were kept under low calcium conditions or treated with calcium for 2 h before dispase-based cell–cell adhesion assay (Calautti et al., 1998). Data are expressed as the percentage of single cells released by mechanical disruption after dispase treatment versus total number of cells recovered after subsequent treatment of the same samples with trypsin. Bar, 15 μm.
Figure 13.
Figure 13.
Expression of PRK2 induces catenin tyrosine phosphorylation in a Src family–dependent fashion. (A) Keratinocytes were infected with the AdGFP–β-gal or AdPRK2 adenovirus at 50 (PRK2 50) or 100 moi (PRK2 100). 48 h after infection, cell extracts were immunoprecipitated with antibodies against E-cadherin (left) or p120ctn (right) followed by immunoblotting with antibodies against phosphotyrosine (p-Tyr; top) or β- and γ-catenin (β/γ catenin; bottom left) and p120ctn (bottom right). Similar results were obtained in three independent experiments. (B) Keratinocytes were infected at 100 moi with control (AdGFP–β-gal) or PRK2-expressing (PRK2) adenoviruses. 12 h after infection, cells were treated with solvent alone (−) or the indicated concentrations of the PP1 inhibitor. 48 h after infection, cell extracts were immunoprecipitated with antibodies against E-cadherin followed by immunoblotting with antibodies against phosphotyrosine (p-Tyr; top) or β- and γ-catenin (β/γ catenin; bottom).
Figure 13.
Figure 13.
Expression of PRK2 induces catenin tyrosine phosphorylation in a Src family–dependent fashion. (A) Keratinocytes were infected with the AdGFP–β-gal or AdPRK2 adenovirus at 50 (PRK2 50) or 100 moi (PRK2 100). 48 h after infection, cell extracts were immunoprecipitated with antibodies against E-cadherin (left) or p120ctn (right) followed by immunoblotting with antibodies against phosphotyrosine (p-Tyr; top) or β- and γ-catenin (β/γ catenin; bottom left) and p120ctn (bottom right). Similar results were obtained in three independent experiments. (B) Keratinocytes were infected at 100 moi with control (AdGFP–β-gal) or PRK2-expressing (PRK2) adenoviruses. 12 h after infection, cells were treated with solvent alone (−) or the indicated concentrations of the PP1 inhibitor. 48 h after infection, cell extracts were immunoprecipitated with antibodies against E-cadherin followed by immunoblotting with antibodies against phosphotyrosine (p-Tyr; top) or β- and γ-catenin (β/γ catenin; bottom).
Figure 14.
Figure 14.
Expression of PRK2 triggers Fyn kinase activation. (A) Keratinocytes were infected with control (GFP) or PRK2-expressing adenovirus at 50 (PRK2 50) or 100 moi (PRK2 100), and 48 h after infection Fyn and Src activities were measured by immunoprecipitation followed by in vitro autophosphorylation assay (top). Quantification of the results after normalization for Fyn/Src proteins amounts, as detected by immunoblotting (bottom), revealed a 3.2-fold increase of the Fyn kinase activity in cells infected with the PRK2 adenovirus with no significant increase of Src activity. (B) Keratinocytes were infected and processed as in C except that in vitro kinase reactions were performed in the presence of poly Glu-Tyr as a tyrosine kinase-specific substrate (top). Quantification of the results after normalization for Fyn and Src protein amounts (bottom) revealed an ∼2.5-fold increase in Fyn kinase activity in cells infected with the PRK2 adenovirus with no significant changes in Src kinase activity. Similar results were obtained in three other independent experiments. (C) Keratinocytes kept in fully supplemented low calcium medium or serum-starved for 24 h (asterisk) were immunoprecipitated with either Fyn polyclonal antibodies (Fyn IP) or preimmune rabbit immunoglobulins (IgG). Each immunoprecipitate was divided into two aliquots, and these were incubated with a purified recombinant protein, encompassing the constitutively active GST-PKN kinase domain (543–942 amino acids) (PKN K.A.) or the corresponding kinase-dead mutant GST-PKN(543–942)-K644E (PKN K.D.) (Yoshinaga et al., 1999). After a first incubation in cold ATP, samples were extensively washed and incubated in presence of [γ-32P]ATP and Poly-Glu-Tyr as a tyrosine-kinase–specific substrate. Densitometric analysis of the phosphorylated Poly-Glu-Tyr signal coupled to normalization for Fyn protein amounts revealed a 2.8-fold increase of Fyn activity in samples derived from serum-starved keratinocytes incubated with the kinase-active form of PKN relative to the same samples incubated with the kinase-dead mutant. The increase of Fyn kinase activity in immunoprecipitates from keratinocytes in fully supplemented medium was 1.6-fold. The positions of Poly-Glu-Tyr, the autophosphorylated PKN (543–942), and the molecular weight markers are indicated.

References

    1. Anastasiadis, P.Z., S.Y. Moon, M.A. Thoreson, D.J. Mariner, H.C. Crawford, Y. Zheng, and A.B. Reynolds. 2000. Inhibition of RhoA by p120 catenin. Nat. Cell Biol. 2:637–644. - PubMed
    1. Anastasiadis, P.Z., and A.B. Reynolds. 2000. The p120 catenin family: complex roles in adhesion, signaling and cancer. J. Cell Sci. 113:1319–1334. - PubMed
    1. Behrens, J., L. Vakaet, R. Friis, E. Winterhager, F. Van Roy, M.M. Mareel, and W. Birchmeier. 1993. Loss of epithelial differentiation and gain of invasiveness correlates with tyrosine phosphorylation of the E-cadherin/beta-catenin complex in cells transformed with a temperature-sensitive v-SRC gene. J. Cell Biol. 120:757–766. - PMC - PubMed
    1. Belsches, A.P., M.D. Haskell, and S.J. Parsons. 1997. Role of c-Src tyrosine kinase in EGF-induced mitogenesis. Front Biosci. 2:501–518. - PubMed
    1. Bishop, A.L., and A. Hall. 2000. Rho GTPases and their effector proteins. Biochem. J. 348:241–255. - PMC - PubMed

Publication types

MeSH terms

Substances