Comparative Study
. 2002 Jan;12(1):37-46.
doi: 10.1101/gr.205602.

Relating whole-genome expression data with protein-protein interactions

Affiliations
Comparative Study

Relating whole-genome expression data with protein-protein interactions

Ronald Jansen et al. Genome Res. 2002 Jan.

Abstract

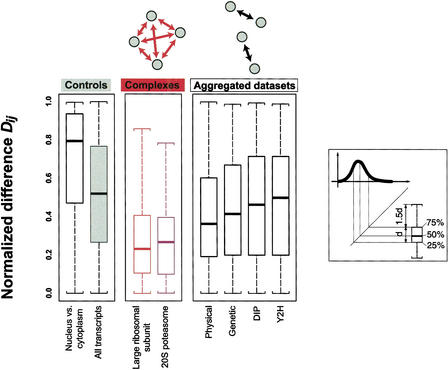
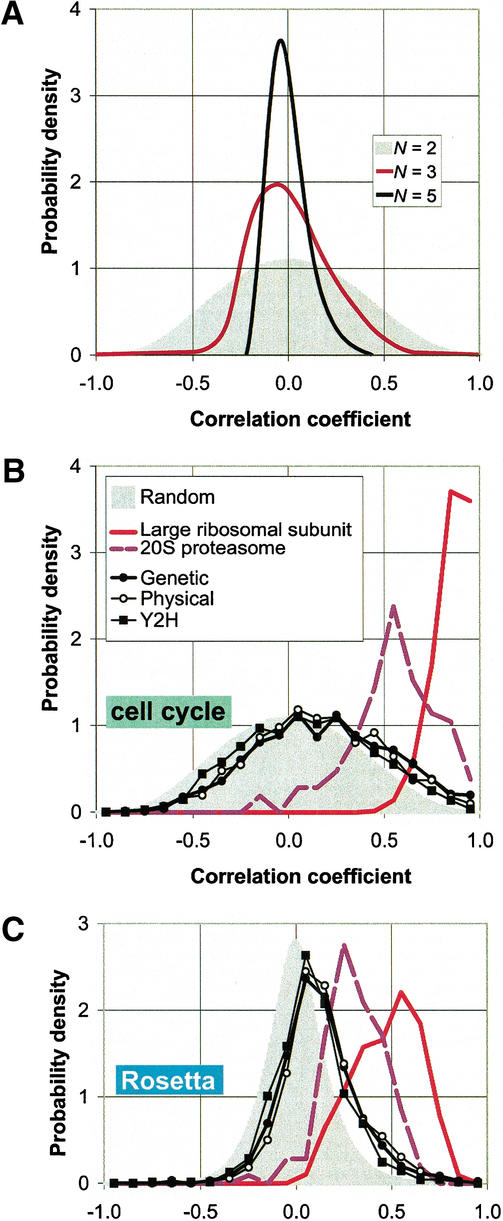
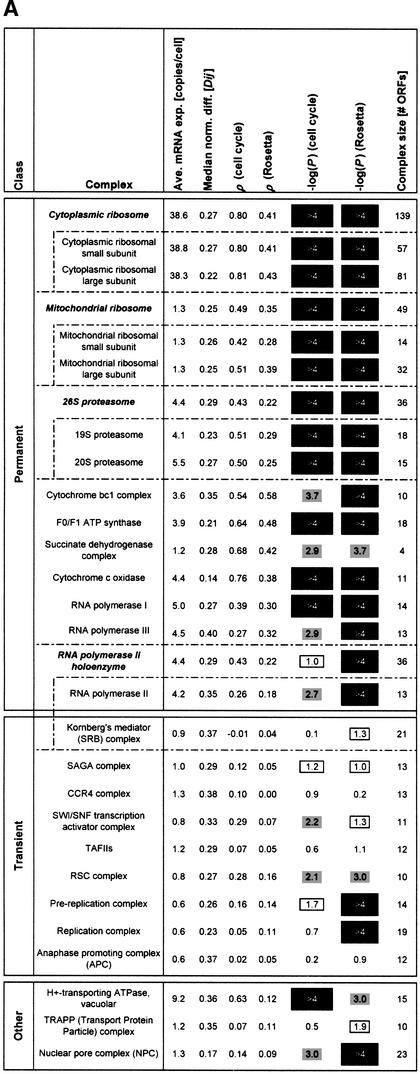
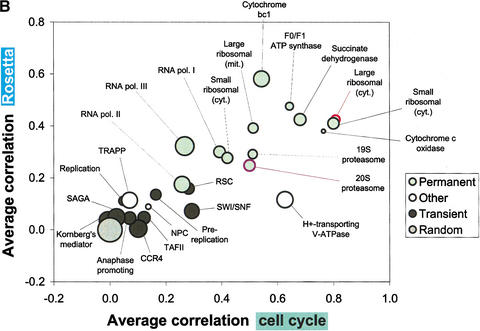
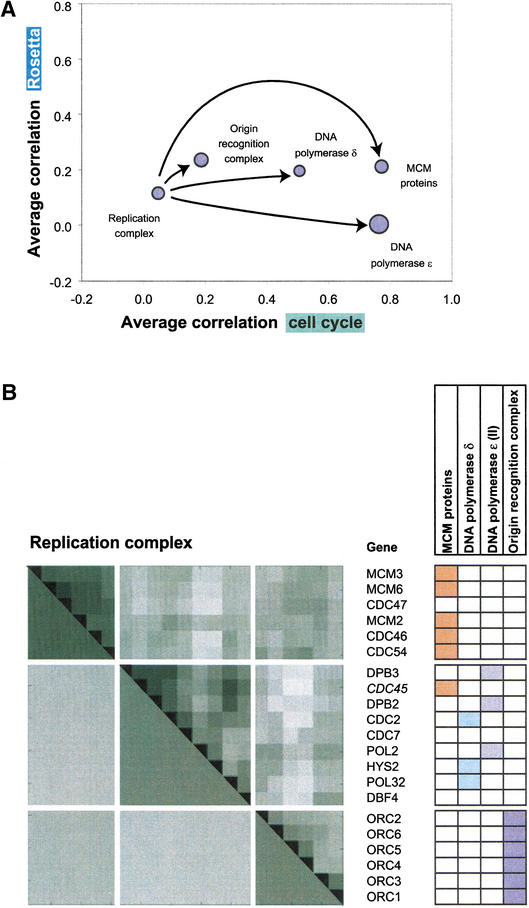
We investigate the relationship of protein-protein interactions with mRNA expression levels, by integrating a variety of data sources for yeast. We focus on known protein complexes that have clearly defined interactions between their subunits. We find that subunits of the same protein complex show significant coexpression, both in terms of similarities of absolute mRNA levels and expression profiles, e.g., we can often see subunits of a complex having correlated patterns of expression over a time course. We classify the yeast protein complexes as either permanent or transient, with permanent ones being maintained through most cellular conditions. We find that, generally, permanent complexes, such as the ribosome and proteasome, have a particularly strong relationship with expression, while transient ones do not. However, we note that several transient complexes, such as the RNA polymerase II holoenzyme and the replication complex, can be subdivided into smaller permanent ones, which do have a strong relationship to gene expression. We also investigated the interactions in aggregated, genome-wide data sets, such as the comprehensive yeast two-hybrid experiments, and found them to have only a weak relationship with gene expression, similar to that of transient complexes. (Further details on genecensus.org/expression/interactions and bioinfo.mbb.yale.edu/expression/interactions.)


Figures

Figure 1
Figure 1
Distributions of normalized differences for various groups of proteins in boxplot representation. The normalized difference Dij is a measure of the relative similarity of two absolute gene expression levels Ei and Ej. The middle panel shows the distribution for two protein complexes (the large ribosomal subunit and the 20S proteasome). Note that we considered all theoretically possible protein pairs within the protein complex (as indicated in the schematic drawing above the panel). The right panel shows the distribution for the aggregated data sets of protein-protein interactions (Y2H is yeast two-hybrid) (Bader and Hogue 2000; Cagney et al. 2000; Fellenberg et al. 2000; Ito et al. 2000; Schwikowski et al. 2000; Uetz et al. 2000; Uetz and Hughes 2000; Xenarios 2000; Ito et al. 2001). Unlike in the complexes, where we consider interactions among a whole group of proteins, the interactions in the aggregated data sets are specific to individual protein pairs (see schematic drawing). The left panel shows two control distributions of the normalized difference, on the left for pairs of nuclear and cytoplasmic proteins, which presumably, because of spatial separation, do not interact, and on the right for any random protein pair (“all transcripts”) in yeast. The distribution of nuclear versus cytoplasmic proteins is strongly skewed toward one (the maximum value of the normalized difference), which is partially explained by the fact that cytoplasmic proteins tend to have higher expression levels than cytoplasmic ones (Drawid 2000; Drawid and Gerstein 2000). The distribution of all transcripts is nearly uniform (with a median of 0.5) (see Methods). The complexes distributions are clearly skewed toward zero with medians between 0.2 and 0.3. The medians of the distributions of the aggregated data sets are still somewhat smaller than the control median, most notably for the physical interactions data set; on the other hand, there is virtually no difference between the control and the distribution of the yeast two-hybrid data set. The aggregated data, obviously, includes some interactions implied by the complexes, with the degree of intersection ranging from 35% for the physical interactions to ∼6% for Y2H.
Figure 2
Figure 2
Distributions of correlation coefficients between expression profiles. In A, we show distributions of the average correlation ρ̄N of N genes for the cell cycle experiments. The gray curve in the background represents the case N = 2 (i.e., simply the distribution of pair-wise correlations). In the case of N >2, ρ̄N is defined as the average of all possible (N2N)/2 pairwise correlations among the N genes. We show here, as examples, the distributions for N = 3 and N  = 5. The distributions obviously become narrower, reflecting the fact that it becomes more unlikely to find large groups of strongly correlated genes at random as N increases. These distributions provide a suitable control for the observed correlations between pairs of genes (N  = 2) or for the average correlations among the subunits of a complex (N>2). We have developed a method to efficiently sample the distribution curves f(ρN) (see Methods). Based on the distribution function of f(ρN) we can calculate a one-sided P-value: formula image This P-value then represents the chance that a group of N randomly selected genes could exhibit an average correlation greater than or equal to that of a complex with N proteins (see Fig. 3). (B and C) The distribution of pair-wise correlations for both the cell cycle (Cho et al. 1998) and the Rosetta experiments (Hughes et al. 2000) in two protein complexes (the ribosome and the proteasome) as well as for the aggregated data sets (genetic, physical and yeast two-hybrid). The gray curves in the background are the control distributions for N  = 2 as explained above. The distributions for the ribosome and the proteasome are strongly shifted to the right of the control; this effect is much weaker for the data sets of aggregated interactions.
Figure 3
Figure 3
(A) Consolidates various key statistics shown in Figures 1 and 2 for the ribosome and proteasome as well as for a large number of protein complexes. We list all protein complexes from the MIPS catalog having at least 10 open reading frames (ORFs). The complexes are divided into three classes: permanent, transient, or other (see below). Some complexes can be divided into smaller subcomplexes (e.g., the ribosomes) as indicated. The table lists (from left to right) the average expression level of the complex, the median normalized difference (see Fig. 1A), the average correlation for the cell cycle and Rosetta experiments (see Fig. 2), the negative logarithm of the P-value of the average correlations in both experiments (see Fig. 2), and the size of the complex in terms of the number of ORFs. In general, the P-values for the average correlations are very low for most of the permanent protein complexes [accordingly, −log10(P) is very high], indicating that these averages are significantly greater than for random groups of proteins of the same size. The same cannot be observed for the transient protein complexes, for which the correlation averages are usually much smaller. The section “other” at the bottom of A contains complexes that are either difficult to classify as permanent/transient or for which, as a result of very small turnover rates, down-regulations of mRNA levels take a very long time to affect protein abundance. The H+-transporting ATPase can be thought of as containing a mixture of permanent and transient components at the same time (P. Kane, pers. comm.). The nuclear pore complex (NPC) and the TRAPP complex are known to have low turnover rates (Bucci and Wente 1997; Winey et al. 1997; Sacher et al. 1998; Barrowman et al. 2000). The NPC has relatively small average correlations, but this still yields P-values of 10–3 (cell cycle) and <10−4 (Rosetta) because the nuclear pore complex is a relatively large aggregation of proteins, and even these weak average correlations are very unlikely to occur for random groups of proteins of this size. The TRAPP protein complex, while existing throughout the cell cycle, has a low turnover rate and as such its mRNA expression data would not be sufficient for our analysis. The RNA polymerase holoenzyme is composed of both permanent and transient components. Note that the MIPS complexes catalog does not include the SWI/SNF chromatin-remodeling complex and a subset of basal transcription factors (Wilson et al. 1996) as part of the holoenzyme, thus we list them separately here. The list does not include those categories from the MIPS complexes catalog that do not really represent protein complexes per se, but rather aggregations of disparate proteins that are involved in similar types of complex interactions, such as the “actin-associated” and “tubulin-associated” protein groups. (B) Shows a graphical representation of part of the protein complex statistics from A. The abscissa and ordinate represent the average correlations in the cell cycle and the Rosetta data, while the bubble sizes are a function of the normalized differences (larger bubbles represent larger normalized differences). In general, the permanent complexes tend to be located in the upper right region of the plot, whereas transient complexes are closer to the random control in the lower left.
Figure 3
Figure 3
(A) Consolidates various key statistics shown in Figures 1 and 2 for the ribosome and proteasome as well as for a large number of protein complexes. We list all protein complexes from the MIPS catalog having at least 10 open reading frames (ORFs). The complexes are divided into three classes: permanent, transient, or other (see below). Some complexes can be divided into smaller subcomplexes (e.g., the ribosomes) as indicated. The table lists (from left to right) the average expression level of the complex, the median normalized difference (see Fig. 1A), the average correlation for the cell cycle and Rosetta experiments (see Fig. 2), the negative logarithm of the P-value of the average correlations in both experiments (see Fig. 2), and the size of the complex in terms of the number of ORFs. In general, the P-values for the average correlations are very low for most of the permanent protein complexes [accordingly, −log10(P) is very high], indicating that these averages are significantly greater than for random groups of proteins of the same size. The same cannot be observed for the transient protein complexes, for which the correlation averages are usually much smaller. The section “other” at the bottom of A contains complexes that are either difficult to classify as permanent/transient or for which, as a result of very small turnover rates, down-regulations of mRNA levels take a very long time to affect protein abundance. The H+-transporting ATPase can be thought of as containing a mixture of permanent and transient components at the same time (P. Kane, pers. comm.). The nuclear pore complex (NPC) and the TRAPP complex are known to have low turnover rates (Bucci and Wente 1997; Winey et al. 1997; Sacher et al. 1998; Barrowman et al. 2000). The NPC has relatively small average correlations, but this still yields P-values of 10–3 (cell cycle) and <10−4 (Rosetta) because the nuclear pore complex is a relatively large aggregation of proteins, and even these weak average correlations are very unlikely to occur for random groups of proteins of this size. The TRAPP protein complex, while existing throughout the cell cycle, has a low turnover rate and as such its mRNA expression data would not be sufficient for our analysis. The RNA polymerase holoenzyme is composed of both permanent and transient components. Note that the MIPS complexes catalog does not include the SWI/SNF chromatin-remodeling complex and a subset of basal transcription factors (Wilson et al. 1996) as part of the holoenzyme, thus we list them separately here. The list does not include those categories from the MIPS complexes catalog that do not really represent protein complexes per se, but rather aggregations of disparate proteins that are involved in similar types of complex interactions, such as the “actin-associated” and “tubulin-associated” protein groups. (B) Shows a graphical representation of part of the protein complex statistics from A. The abscissa and ordinate represent the average correlations in the cell cycle and the Rosetta data, while the bubble sizes are a function of the normalized differences (larger bubbles represent larger normalized differences). In general, the permanent complexes tend to be located in the upper right region of the plot, whereas transient complexes are closer to the random control in the lower left.
Figure 4
Figure 4
(A) A representation of the replication complex and its components on the same coordinates as the protein complexes in Figure 3B. The transient replication complex can be decomposed into smaller complexes: the origin recognition complex, the MCM proteins, and the DNA polymerases δ and ɛ. Whereas the whole replication complex exhibits an average correlation close to zero (in both the cell cycle and the Rosetta data), the four smaller complexes show greater correlations in the cell cycle experiment. The four subcomplexes behave more like permanent complexes than the replication complex as a whole. (B) The correlation coefficient matrix for the subunits of the replication complex derived from the cell cycle data. The upper triangle of the correlation matrix shows the individual correlation coefficients for particular gene pairs (with darker colors indicating higher correlations). The lower triangle shows the average correlations for subgroups of proteins (representing the MCM proteins, the two DNA polymerases, and the origin of the replication complex) within the complex as a whole. The table on the right side shows which genes belong to which subgroups in different colors. The genes were ordered with unsupervised clustering (average linkage) without regard to their classification according to the three subgroups. It can be seen that this order reflects the separation according to the subgroups very well (only the proteins in the two DNA polymerase cannot be separated into two groups). An exception is the CDC45 protein that belongs to the MCM proteins but tends to cluster with the DNA polymerases.

References

    1. Anderson L, Seilhamer J. A comparison of selected mRNA and protein abundances in human liver. Electrophoresis. 1997;18:533–537. - PubMed
    1. Aparicio OM, Weinstein DM, Bell SP. Components and dynamics of DNA replication complexes in S. cerevisiae: Redistribution of MCM proteins and Cdc45p during S phase. Cell. 1997;91:59–69. - PubMed
    1. Ashburner M, Ball CA, Blake JA, Botstein D, Butler H, Cherry JM, Davis AP, Dolinski K, Dwight SS, Eppig JT, et al. Gene ontology: Tool for the unification of biology. The Gene Ontology Consortium. Nat Genet. 2000;25:25–29. - PMC - PubMed
    1. Bader GD, Hogue CW. BIND—A data specification for storing and describing biomolecular interactions, molecular complexes and pathways. Bioinformatics. 2000;16:465–477. - PubMed
    1. Barrowman J, Sacher M, Ferro-Novick S. TRAPP stably associates with the Golgi and is required for vesicle docking. EMBO J. 2000;19:862–869. - PMC - PubMed

LinkOut - more resources