Comparative Study
. 2002 Jan;12(1):67-80.
doi: 10.1101/gr.213702.

Human paralogs of KIAA0187 were created through independent pericentromeric-directed and chromosome-specific duplication mechanisms

Affiliations
Comparative Study

Human paralogs of KIAA0187 were created through independent pericentromeric-directed and chromosome-specific duplication mechanisms

Moira Crosier et al. Genome Res. 2002 Jan.

Abstract

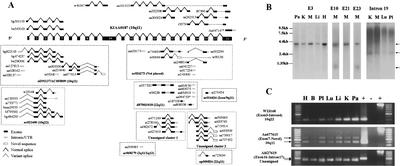
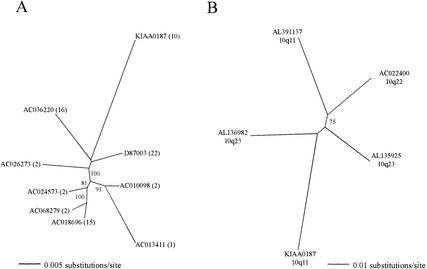
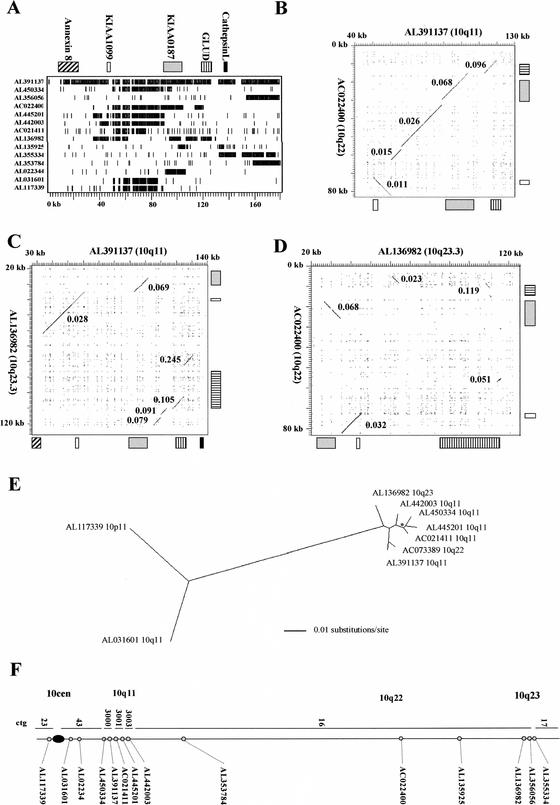
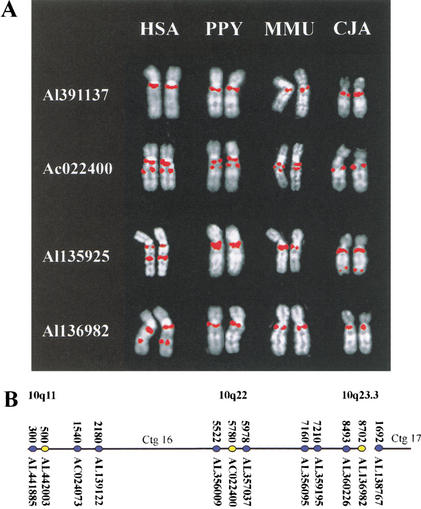
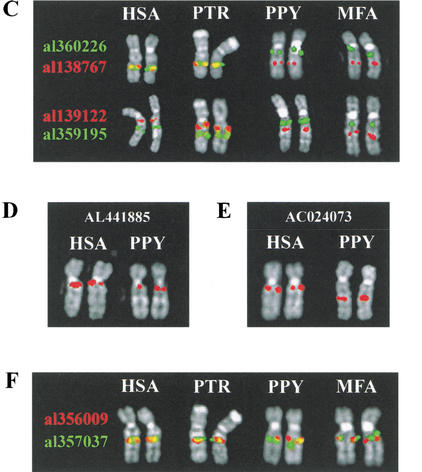
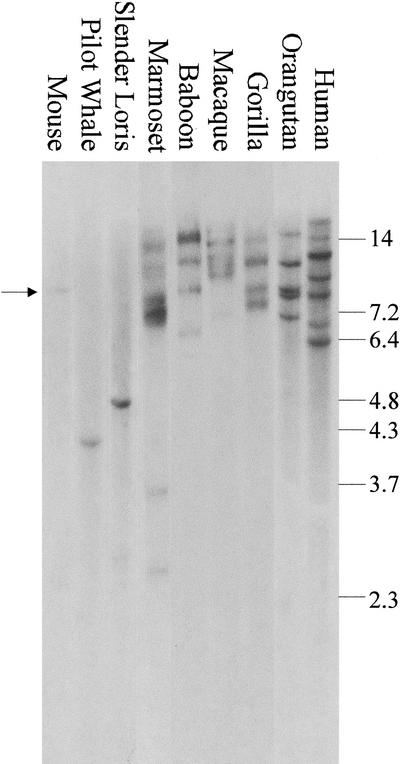
KIAA0187 is a gene of unknown function that maps to 10q11 and has been subject to recent duplication events. Here we analyze 18 human paralogs of this gene and show that paralogs of exons 14-23 were formed through satellite-associated pericentromeric-directed duplication, whereas paralogs of exons 1-9 were created via chromosome-specific satellite-independent duplications. In silico, Northern, and RT-PCR analyses indicate that nine paralogs are transcribed, including four in which KIAA0187 exons are spliced onto novel sequences. Despite this, no new genes appear to have been created by these events. The chromosome 10 paralogs map to 10q11, 10q22, 10q23.1, and 10q23.3, forming part of a complex family of chromosome-specific repeats that includes GLUD1, Cathepsin L, and KIAA1099 pseudogenes. Phylogenetic analyses and comparative FISH indicates that the 10q23.1 and 10q23.3 repeats were created in 10q11 and relocated by a paracentric inversion 13 to 27 Myr ago. Furthermore, the most recent duplications, involving the KIAA1099 pseudogenes, have largely been confined to 10q11. These results indicate a simple model for the evolution of this repeat family, involving multiple rounds of centromere-proximal duplication and dispersal through intrachromosomal rearrangement. However, more complex events must be invoked to account for high sequence identity between some paralogs.


Figures

Figure 1
Figure 1
Structure of the KIAA0187 gene and its human paralogs. (A) Schematic of KIAA0187 intron/exon organization. The size of each intron is given in base pairs below the schematic. Nucleotide positions defining each exon are shown above the schematic, taking the A of the initiation codon as position 1 because the transcription start site has not been defined. All splice sites conform to the GT-AG rule. Untranslated regions are indicated in grey, and exon numbers are shown when resolution allows. (B) Physical structure of human paralogs. Solid horizontal lines indicate the extent of paralogy relative to the KIAA0187 gene. Solid vertical bars are shown when the terminus of paralogy can be defined; arrows are shown when it cannot be defined because of the incomplete nature of the sequence. Paralogous sequences that are contiguous within a single clone but are physically separated within the KIAA0187 gene are indicated by a dashed line joining the domains of paralogy. The positions of satellite arrays are shown if they are present within 1 kb of the terminus of paralogy. The chromosome 22 paralogs (ap000525/526 and d87003/d87018) have been characterized previously (Dunham et al. 1999; Eichler et al. 1999; Guy et al. 2000). Physical scale in kilobases is shown relative to Guy et al. (2000).
Figure 2
Figure 2
Transcriptional analysis of KIAA0187. (A) Structure of expressed sequence tags (ESTs) related to KIAA0187. The structure of KIAA0187-related ESTs is shown relative to the exon/intron organization of the functional gene with ESTs from this locus shown above the schematic. Two clusters of ESTs could not be unambiguously assigned to any genomic sequence (see Methods). The four ESTs in unassigned cluster 1 share seven nucleotides that are not present in any genomic paralog, whereas the six ESTs in unassigned cluster 2 share six unique nucleotides (data not shown), indicating that they are not derived from any of the known genomic loci. ESTs labeled with an asterisk (aa047147 from the functional gene and aa994753 from d87003/018 in 22q11) represent ∼20 ESTs with very similar structures that have been omitted for clarity. Four ESTs contain sequence unrelated to the 10q11 gene: ESTs AA677615 (10q11) and AA725634 (22q11) are both spliced to anonymous sequence; EST W90094 (not placed) contains exons 16 and 17 spliced onto an Alu element; and ESTs AI653509, AA759017, and AA707452 (unassigned cluster 2) contain exons 20 and 21 spliced onto Aquaporin-related sequences. (B) Northern blots of polyA+ RNA probed with KIAA0187 exons. Panels labeled E3, E10, E21, and E23 and intron 19 were probed with fragments specific for exons 3, 10, 21, and 23 and intron 19, respectively. The three transcripts are indicated with arrows. (C) RT-PCR analyses of KIAA0187 paralogs. The cDNAs shown are as follows: H, heart; B, brain, Pl, placenta; Lu, lung; Li, liver; K, kidney; and Pa, pancreas. The accession number of the ESTs used to design primers specific for the three clusters is shown to the left of each panel, as is the intronic/exonic origin of the two primers. (Middle) The reverse primer is specific for the novel sequence within AA677615 (see A). The first positive control in the top and middle panels is 10 ng of the parent EST. In the bottom panel, it is 50 ng of genomic DNA. The second positive control in all panels is a G3PDH cDNA template amplified using the G3PDH primers (see Methods). The marker is a 100-bp ladder (Promega).
Figure 3
Figure 3
Phylogenetic analysis of KIAA0187 paralogs. The scale for branch lengths is shown, and nodes with >50% bootstrap support are indicated. (A) Maximum-likelihood tree of distal paralogs. Derived from an 1892-bp alignment spanning positions 694294–696183 of the 10q11 sequence (Guy et al. 2000), which contains no exonic sequence. The chromosomal assignment for each clone is shown in brackets. (B) Maximum-likelihood tree of proximal paralogs. Derived from a 1909-bp alignment spanning positions 666815–668710 of the 10q11 sequence (Guy et al. 2000), which contains 235 bp of exonic sequence. The map position on chromosome 10 is shown for each sequence.
Figure 4
Figure 4
Analysis of pseudogene clusters containing KIAA0187 paralogs. (A) Human genomic blast hits to AL391137. The position of all independent human clones with >90% sequence identity to AL391137 over >2 kb are shown relative to RepeatMasked AL391137 sequence (hit 1 is the self-comparison). The positions of gene-related sequences within AL391137 are indicated above, with the scale in kilobases indicated below. Numbers refer to the clones shown in F. The GLUD1-related sequences identified include the functional GLUD1 gene (within hit 8) and two nonprocessed pseudogene fragments, one of which (GLUDP3 within hit 4) has been previously mapped to 10q22 (Deloukas et al. 1993). The Cathepsin L–related sequences include two pseudogenes, CTSLL1 and CTSLL1-2 (within hits 10 and 1, respectively), which have been mapped previously to 10q (Bryce et al. 1994). (B–D) Dot matrix analyses of 10q pseudogene clusters. The positions of gene-related sequences are shown for each clone. Kimura 2 parameter distances for each individual region of high identity are indicated. The highly diverged match in C (K2P = 0.245) is owing to a cluster of Alu elements and is assumed to be coincidental. (E) Maximum-likelihood tree of KIAA1099 paralogs generated from a 10952-bp alignment spanning nucleotides 55178–59761 of AL391137. The scale (in substitutions/site) for the branch lengths is shown. All branchpoints have >95% bootstrap support with a single exception (asterisk), which has 81% support. (F) Distribution of sequences related to AL391137 on chromosome 10. The position of each clone identified in the BLAST analysis within Sanger Centre contigs (Bentley et al. 2001) is shown. Cytogenetic locations (established by FISH; Table 1) are also shown.
Figure 5
Figure 5
Comparative analysis of primates. Species used are as follows: hsa, human; PTR, chimpanzee; PPY, orangutan; MMU, rhesus monkey; MFA, crab-eating macaque; and CJA, common marmoset. Individual chromosomes (HSA 10 or syntenic equivalent) rather than complete metaphase spreads are shown for clarity. The species origin of each pair of chromosomes is indicated at the top of each panel. The identity of the probes used in C and F is indicated by the color of the accession number to the left of each panel. For the relative position of probes used in A, see Table 1. For the relative position of probes used in CF, see B. (A) Comparative mapping of clones containing proximal KIAA0187 paralogs. A clone containing the functional KIAA0187 gene hybridizes specifically to 10q11 in all four species. A signal is observed close to the telomere of the long arm in CJA using AL135925, indicating further lineage-specific dispersal of sequences in this clone. (B) Relative position of clones used in analyses of rearrangement. The position of each clone within Sanger Centre contigs 16 and 17 are shown in blue. The position of 10q11, 10q22, and 10q23.3 paralog clusters are shown in yellow. Contigs 16 and 17 extend from 10q11 to 10q25, with a single gap in 10q23.3. (Bentley et al. 2001). (C) Comparative analysis of clones flanking the 10q23.3 paralog cluster. (D) Delineation of proximal inversion breakpoint. (E) Comparative analysis of clones flanking the 10q22 paralog cluster.
Figure 5
Figure 5
Comparative analysis of primates. Species used are as follows: hsa, human; PTR, chimpanzee; PPY, orangutan; MMU, rhesus monkey; MFA, crab-eating macaque; and CJA, common marmoset. Individual chromosomes (HSA 10 or syntenic equivalent) rather than complete metaphase spreads are shown for clarity. The species origin of each pair of chromosomes is indicated at the top of each panel. The identity of the probes used in C and F is indicated by the color of the accession number to the left of each panel. For the relative position of probes used in A, see Table 1. For the relative position of probes used in CF, see B. (A) Comparative mapping of clones containing proximal KIAA0187 paralogs. A clone containing the functional KIAA0187 gene hybridizes specifically to 10q11 in all four species. A signal is observed close to the telomere of the long arm in CJA using AL135925, indicating further lineage-specific dispersal of sequences in this clone. (B) Relative position of clones used in analyses of rearrangement. The position of each clone within Sanger Centre contigs 16 and 17 are shown in blue. The position of 10q11, 10q22, and 10q23.3 paralog clusters are shown in yellow. Contigs 16 and 17 extend from 10q11 to 10q25, with a single gap in 10q23.3. (Bentley et al. 2001). (C) Comparative analysis of clones flanking the 10q23.3 paralog cluster. (D) Delineation of proximal inversion breakpoint. (E) Comparative analysis of clones flanking the 10q22 paralog cluster.
Figure 6
Figure 6
Zoo blot of mammalian and primate species. DNAs were digested with EcoRI and probed with a PCR product specific for exon 3 of KIAA0187 (see Methods) The weak band of hybridization in mouse is indicated with an arrow. Size of marker fragments are given in kilobase pairs.

References

    1. Altschul SF, Gish W, Miller W, Myers EW, Lipman DJ. Basic local alignment search tool. J Mol Biol. 1990;215:403–410. - PubMed
    1. Antonacci R, Marzella R, Finelli P, Lonoce A, Forabosco A, Archiadiacono N, Rocchi M. A panel of subchromosomal painting libraries representing over 300 regions of the human genome. Cytogenet Cell Genet. 1995;68:25–32. - PubMed
    1. Bailey JA, Yavor AM, Massa HF, Trask BJ, Eichler EE. Segmental duplications: Organization and impact within the current human genome project assembly. Genome Res. 2001;11:1005–1017. - PMC - PubMed
    1. Bayne RA, Broccoli D, Taggart MH, Thomson EJ, Farr CJ, Cooke HJ. Sandwiching of a gene within 12 kb of a functional telomere and alpha satellite does not result in silencing. Hum Mol Genet. 1994;3:539–546. - PubMed
    1. Barber JC, Cross IE, Douglas F, Nicholson JC, Moore KJ, Browne CE. Neurofibromatosis pseudogene amplification underlies euchromatic cytogenetic duplications and triplications of proximal 15q. Hum Genet. 1998;103:600–607. - PubMed

LinkOut - more resources