. 2002 Jan;12(1):98-111.
doi: 10.1101/gr.201501.

Changes in gene expression profiles in developing B cells of murine bone marrow

Affiliations

Changes in gene expression profiles in developing B cells of murine bone marrow

Reinhard Hoffmann et al. Genome Res. 2002 Jan.

Abstract

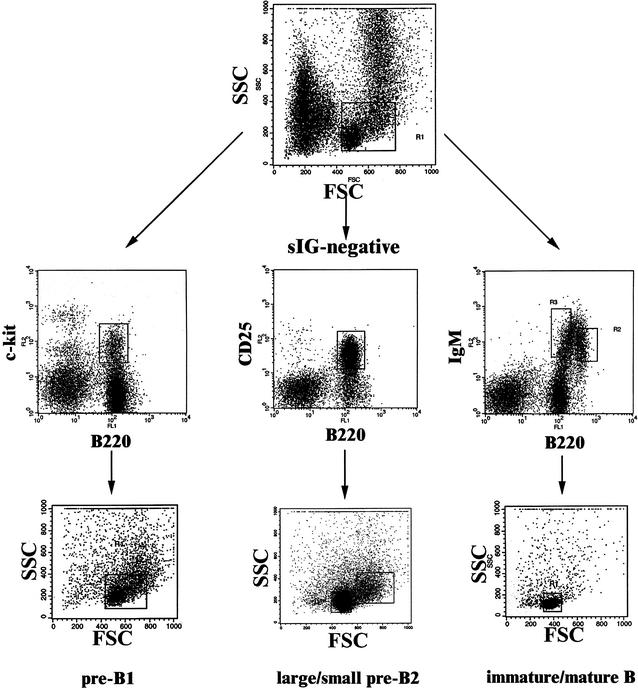
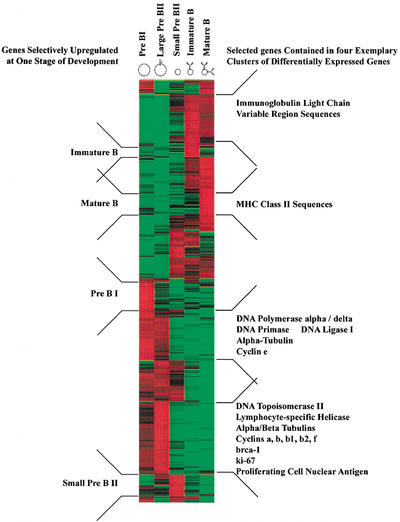
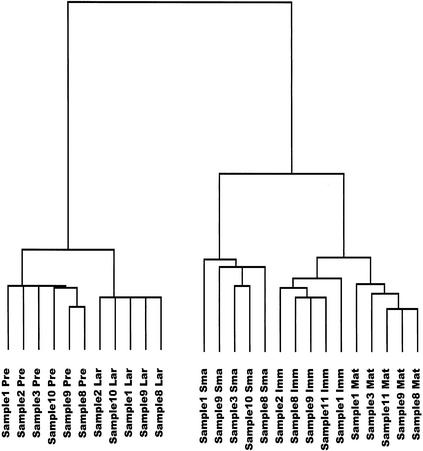
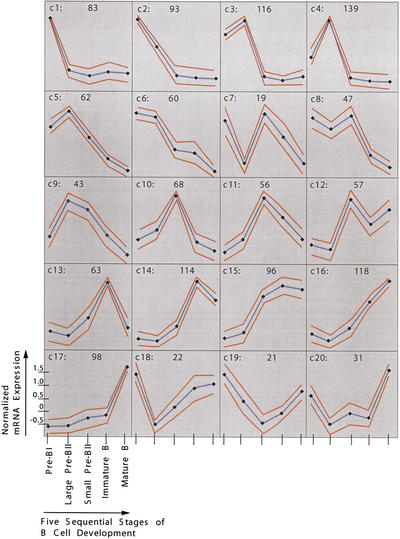
Gene expression profiles of five consecutive stages of mouse B cell development were generated with high-density oligonucleotide arrays from as few as 2 x 10(4) ex vivo isolated and flow-cytometrically purified cells. Between 2.8% and 6.8% of all genes change on differentiation from one cellular stage to the next by at least twofold. The entire pathway involves differential expression of 10.7% of all genes. Previously known expression patterns of 15 genes (like surrogate light chain, RAG-1/2, MHC class II, mel-14 antigen) are confirmed. The gene expression patterns of the proliferating pre-BI and large pre-BII cells on the one hand, and the resting immature and mature B cells on the other hand, are most similar to each other. Small pre-BII cells display a pattern that is transitional between these two groups. Most of the genes expressed in early precursors are involved in general processes, like protein folding or cell cycle regulation, whereas more mature precursors express genes involved in more specific molecular programs (cell surface receptors, secreted factors, and adhesion molecules, among others). Between 19 and 139 genes share a given expression pattern. Combining knowledge about gene function and expression pattern allows identification of novel candidate genes potentially involved in self-maintenance of pre-BI cells, allelic exclusion and pre-B cell receptor signaling in large pre BII cells, cell-cycle arrest of small pre-BII cells, propensity toward apoptosis or anergization in immature B cells, propensity toward cell division and activation in mature B cells, and stage-specific interactions with stromal cells in the bone marrow.


Figures

Figure 1
Figure 1
Flow cytometric purification of mouse B-cell precursors in three steps. Step 1 (top row): Enrichment of lymphoid cells. Shown is a forward–sideward scatter plot of total femoral bone marrow cells. The boxed area indicates the lymphoid gate. Second step (middle row): Enrichment of c-kit+B220+ pre-BI cells, CD25 +B220+ pre-BII cells, and sIgM+B220+ immature/mature B cells. Surface marker staining of three aliquots of lymphoid-gated bone marrow cells is shown. Pre-BI and immature/mature B cells were sorted as indicated by the gates displayed as boxes in the top and middle rows. Third step (bottom row): Separation of pre-BII cells according to cell size. Shown are forward–sideward scatter plots of cells gated as in the middle row. Pre-BII cells were separated according to cell size into the large pre-BII cells (right box) and small pre-BII cells (left box). Note that pre-BI cells consist of a small and a large subpopulation, which were not separated. Immature and mature B cells were sorted according to the gates shown in the middle row, right panel. As both populations consist of homogeneous small cells, only one back-gated forward–sideward scatter plot is shown in the right panel of the bottom row.
Figure 2
Figure 2
Hierarchical cluster analysis of 1406 differentially expressed genes as detected by ANOVA with 98% confidence (measured by Kruskal-Wallis statistics) with a change of at least twofold and a difference of at least 100 average difference units (for details see Methods). Genes are organized in rows, whereas the five columns represent the five developmental stages from the most immature, pre-BI compartment on the left to the most mature compartment, mature B cells on the right. The expression level of every gene for every developmental stage has been normalized. Green denotes a normalized expression level below, black near to, and red above the mean. Developmental stage-specific clusters are indicated on the left and clusters of selected functional classes of genes are indicated on the right side of the plot.
Figure 3
Figure 3
Tree diagram displaying correlations between gene expression patterns from individual replicate experiments of the five stages of B-cell differentiation, based on the set of 1406 differentially expressed genes. Shorter branches indicate more similar gene expression profiles. (Sample) Number of the sample (consisting of cells pooled from four mice) from which the cell populations have been purified by FACS, numbered consecutively from the beginning of the study; (Pre) pre-BI cells; (Lar) large pre BII cells; (Sma) small pre-BII cells; (Imm) immature B cells; (Mat) mature B cells.
Figure 4
Figure 4
Gene expression patterns identified by self-organizing maps. The cluster numbers are indicated on the top left of each cluster diagram, and the number of genes plus ESTs belonging to every cluster is indicated on the top right. Expression levels are shown on y-axis and developmental stages on x-axis. Dots indicate developmental stages, with the most immature, pre-BI cells on the left and the most mature, that is, mature B cells, on the right. Expression level of each gene was normalized to have mean = 0 and SD = 1 across developmental stages. Blue and red lines indicate expression level means and standard deviations, respectively.

References

    1. Cheng G, Baltimore D. TANK, a co-inducer with TRAF2 of TNF- and CD 40L-mediated NF-kappaB activation. Genes & Dev. 1996;10:963–973. - PubMed
    1. Chin D, Means AR. Calmodulin: A prototypical calcium sensor. Trends Cell Biol. 2000;10:322–328. - PubMed
    1. Coutavas EE, Hsieh CM, Ren M, Drivas GT, Rush MG, D'Eustachio PD. Tissue-specific expression of Ran isoforms in the mouse. Mamm Genome. 1994;5:623–628. - PubMed
    1. Eberwine J, Yeh H, Miyashiro K, Cao Y, Nair S, Finnell R, Zettel M, Coleman P. Analysis of gene expression in single live neurons. Proc Natl Acad Sci. 1992;89:3010–3014. - PMC - PubMed
    1. Eisen MB, Spellman PT, Brown PO, Botstein D. Cluster analysis and display of genome-wide expression patterns. Proc Natl Acad Sci. 1998;95:14863–14868. - PMC - PubMed

Publication types