

Reduced expression of the murine p85alpha subunit of phosphoinositide 3-kinase improves insulin signaling and ameliorates diabetes
- PMID: 11781359
- PMCID: PMC150818
- DOI: 10.1172/JCI13305
Reduced expression of the murine p85alpha subunit of phosphoinositide 3-kinase improves insulin signaling and ameliorates diabetes
Abstract
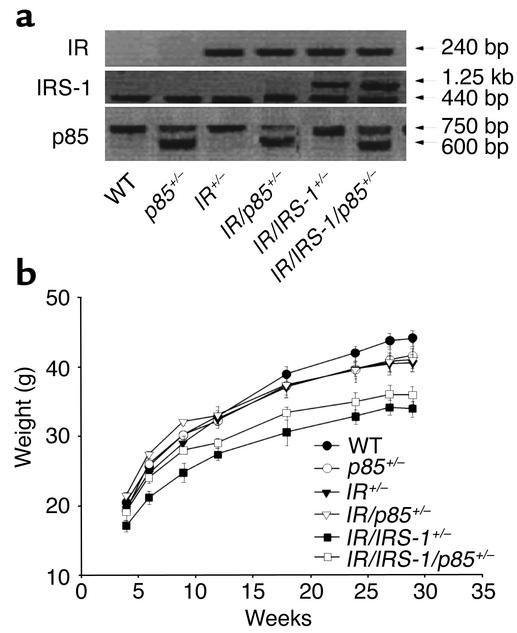
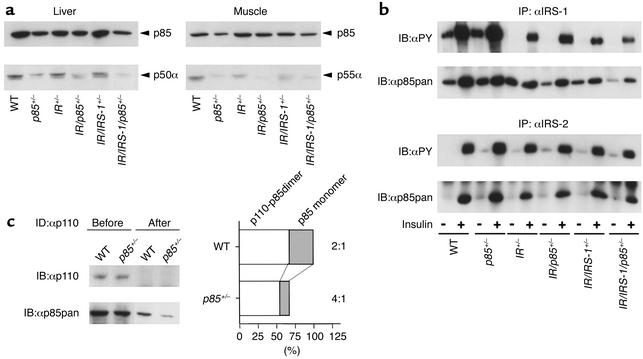
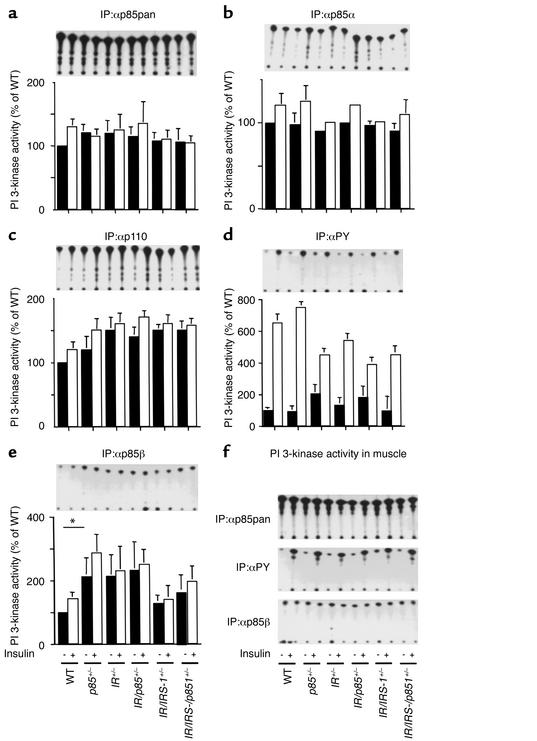
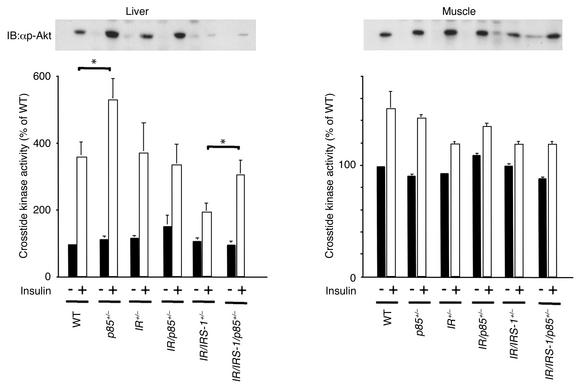
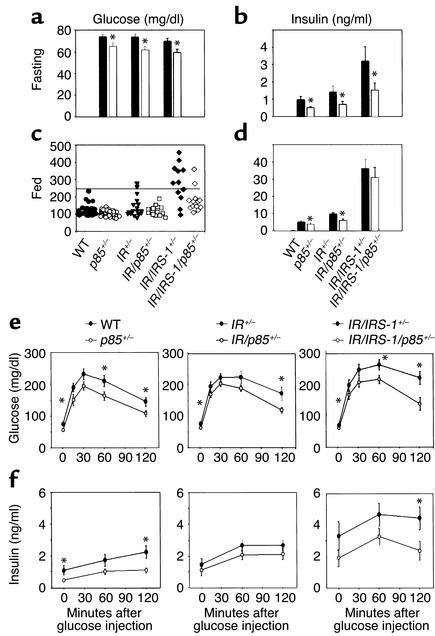
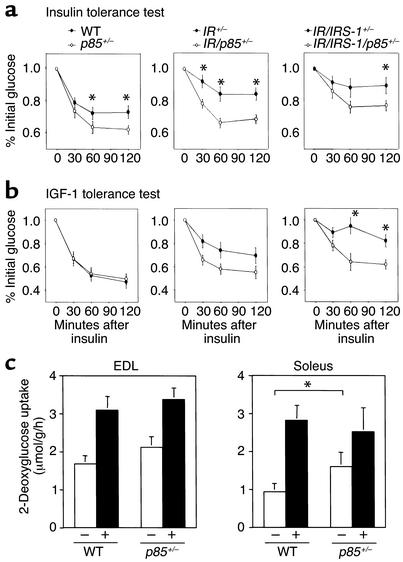
A critical component of insulin action is the enzyme phosphoinositide (PI) 3-kinase. The major regulatory subunits of PI 3-kinase, p85alpha and its splice variants, are encoded by the Pik3r1 gene. Heterozygous disruption of Pik3r1 improves insulin signaling and glucose homeostasis in normal mice and mice made insulin-resistant by heterozygous deletion of the Insulin receptor and/or insulin receptor substrate-1 (IRS1) genes. Reduced expression of p85 modulates the molecular balance between this protein, the p110 catalytic subunit of PI 3-kinase, and the IRS proteins. Thus, despite the decrease in p85alpha, PI 3-kinase activation is normal, insulin-stimulated Akt activity is increased, and glucose tolerance and insulin sensitivity are improved. Furthermore, Pik3r1 heterozygosity protects mice with genetic insulin resistance from developing diabetes. These data suggest that regulation of p85alpha levels may provide a novel therapeutic target for the treatment of type 2 diabetes.
Figures
Similar articles
-
Molecular balance between the regulatory and catalytic subunits of phosphoinositide 3-kinase regulates cell signaling and survival.Mol Cell Biol. 2002 Feb;22(3):965-77. doi: 10.1128/MCB.22.3.965-977.2002. Mol Cell Biol. 2002. PMID: 11784871 Free PMC article.
-
Rescuing 3T3-L1 adipocytes from insulin resistance induced by stimulation of Akt-mammalian target of rapamycin/p70 S6 kinase (S6K1) pathway and serine phosphorylation of insulin receptor substrate-1: effect of reduced expression of p85alpha subunit of phosphatidylinositol 3-kinase and S6K1 kinase.Endocrinology. 2009 Mar;150(3):1165-73. doi: 10.1210/en.2008-0437. Epub 2008 Oct 23. Endocrinology. 2009. PMID: 18948408
-
Positive and negative regulation of phosphoinositide 3-kinase-dependent signaling pathways by three different gene products of the p85alpha regulatory subunit.Mol Cell Biol. 2000 Nov;20(21):8035-46. doi: 10.1128/MCB.20.21.8035-8046.2000. Mol Cell Biol. 2000. PMID: 11027274 Free PMC article.
-
[Knockout mouse models for type 2 diabetes. Mice with insulin resistance].Nihon Rinsho. 2002 Aug;60 Suppl 8:64-9. Nihon Rinsho. 2002. PMID: 12355825 Review. Japanese. No abstract available.
-
Divergent roles of the regulatory subunits of class IA PI3K.Front Endocrinol (Lausanne). 2024 Jan 22;14:1152579. doi: 10.3389/fendo.2023.1152579. eCollection 2023. Front Endocrinol (Lausanne). 2024. PMID: 38317714 Free PMC article. Review.
Cited by
-
Central effects of humanin on hepatic triglyceride secretion.Am J Physiol Endocrinol Metab. 2015 Aug 1;309(3):E283-92. doi: 10.1152/ajpendo.00043.2015. Epub 2015 Jun 9. Am J Physiol Endocrinol Metab. 2015. PMID: 26058861 Free PMC article.
-
Tissue-specific targeting of the insulin receptor gene.Endocrine. 2002 Dec;19(3):257-66. doi: 10.1385/ENDO:19:3:257. Endocrine. 2002. PMID: 12624425 Review.
-
A Comprehensive Survey of the Roles of Highly Disordered Proteins in Type 2 Diabetes.Int J Mol Sci. 2017 Sep 21;18(10):2010. doi: 10.3390/ijms18102010. Int J Mol Sci. 2017. PMID: 28934129 Free PMC article.
-
The PI3K-AKT-mTOR Pathway and Prostate Cancer: At the Crossroads of AR, MAPK, and WNT Signaling.Int J Mol Sci. 2020 Jun 25;21(12):4507. doi: 10.3390/ijms21124507. Int J Mol Sci. 2020. PMID: 32630372 Free PMC article. Review.
-
Insulin resistance and diabetes caused by genetic or diet-induced KBTBD2 deficiency in mice.Proc Natl Acad Sci U S A. 2016 Oct 18;113(42):E6418-E6426. doi: 10.1073/pnas.1614467113. Epub 2016 Oct 5. Proc Natl Acad Sci U S A. 2016. PMID: 27708159 Free PMC article.
References
-
- Kahn CR. Banting Lecture. Insulin action, diabetogenes, and the cause of type II diabetes. Diabetes. 1994; 43:1066–1084. - PubMed
-
- Dunaif A. Insulin action in the polycystic ovary syndrome. Endocrinol Metab Clin North Am. 1999; 28:341–359. - PubMed
-
- Inukai K, et al. A novel 55-kDa regulatory subunit for phosphatidylinositol 3-kinase structurally similar to p55PIK is generated by alternative splicing of the p85a gene. J Biol Chem. 1996; 271:5317–5320. - PubMed
Publication types
MeSH terms
Substances
Grants and funding
LinkOut - more resources
Full Text Sources
Other Literature Sources
Medical
Molecular Biology Databases
Research Materials
Miscellaneous
