. 2002 Jan 7;195(1):23-34.
doi: 10.1084/jem.20010724.

Plasmodium falciparum phospholipase C hydrolyzing sphingomyelin and lysocholinephospholipids is a possible target for malaria chemotherapy

Affiliations

Plasmodium falciparum phospholipase C hydrolyzing sphingomyelin and lysocholinephospholipids is a possible target for malaria chemotherapy

Kentaro Hanada et al. J Exp Med. .

Abstract

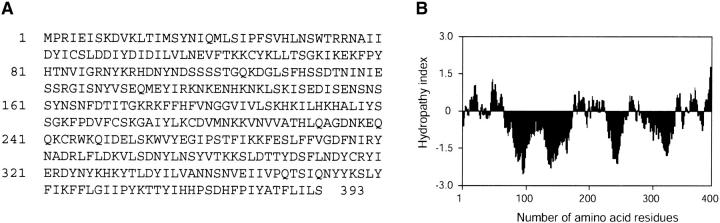
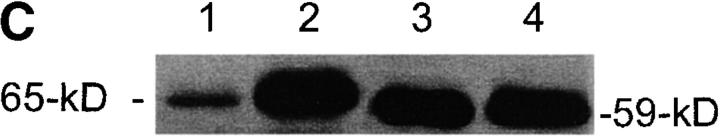
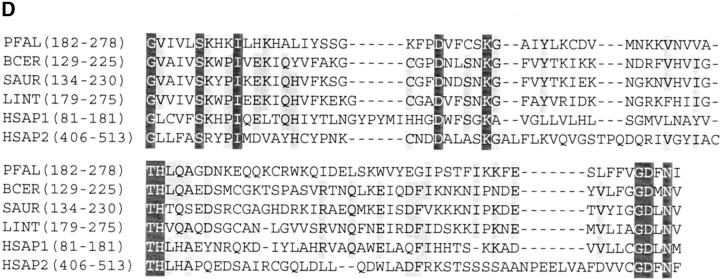
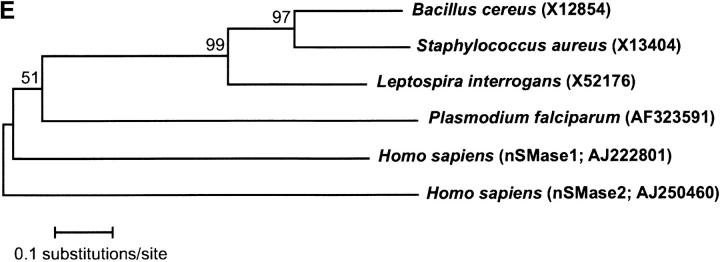
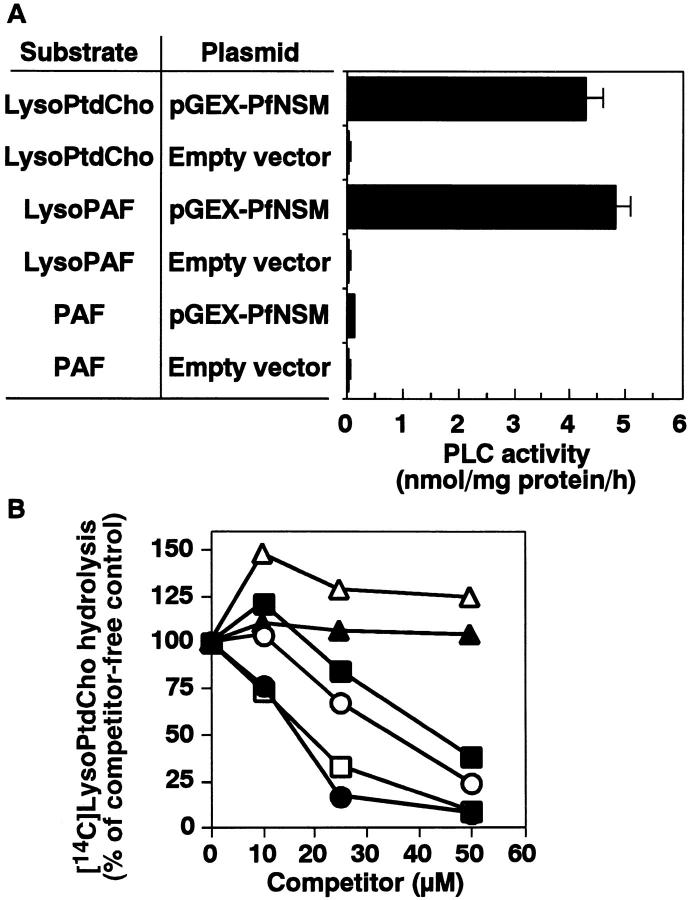
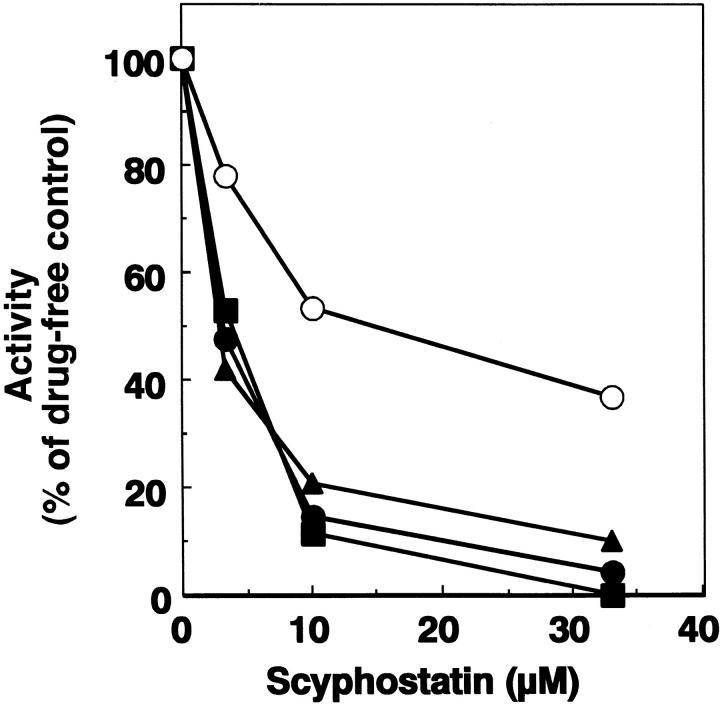
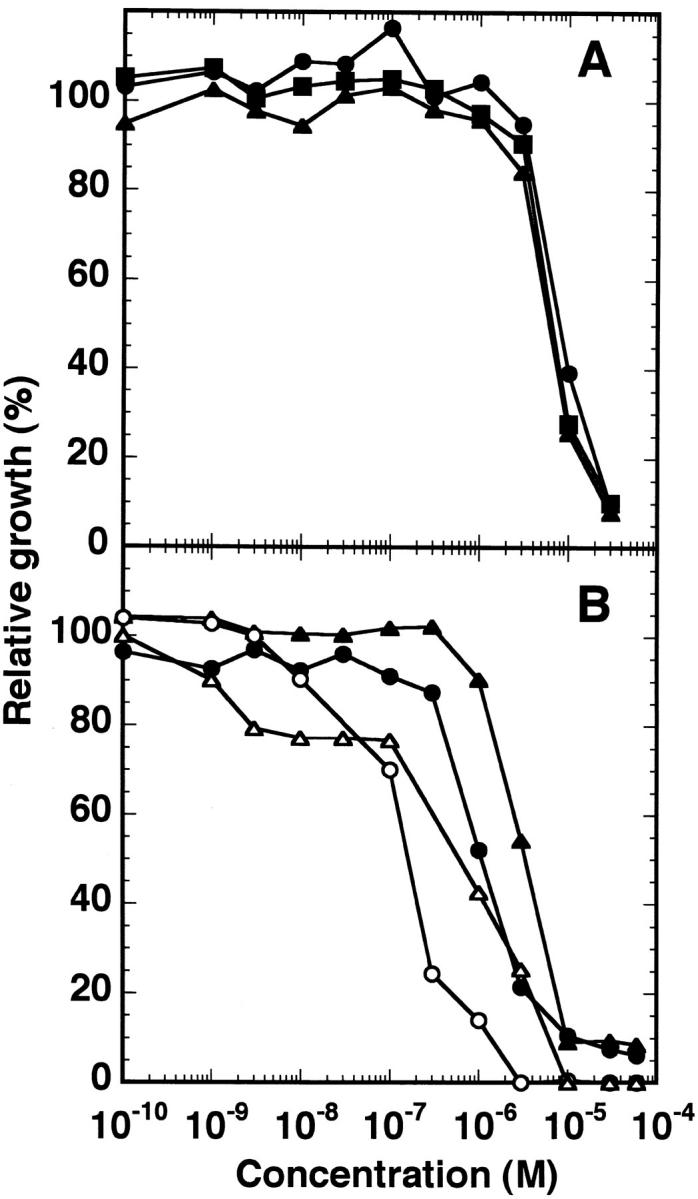
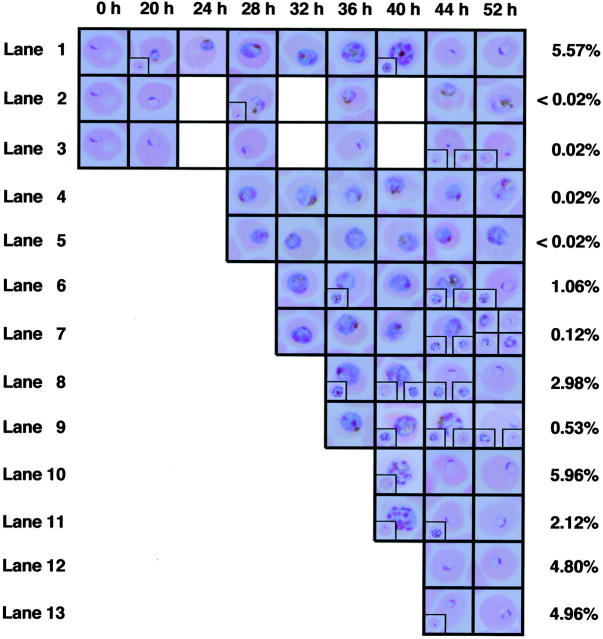
Sphingomyelinase (SMase) is one of the principal enzymes in sphingomyelin (SM) metabolism. Here, we identified a Plasmodium falciparum gene (PfNSM) encoding a 46-kD protein, the amino acid sequence of which is approximately 25% identical to that of bacteria SMases. Biochemical analyses of the recombinant protein GST-PfNSM, a fusion protein of the PfNSM product with glutathione-S-transferase, reveal that this enzyme retained similar characteristics in various aspects to SMase detected in P. falciparum-infected erythrocytes and isolated parasites. In addition, the recombinant protein retains hydrolyzing activity not only of SM but also of lysocholinephospholipids (LCPL) including lysophosphatidylcholine and lysoplatelet-activating factor, indicating that PfNSM encodes SM/LCPL-phospholipase C (PLC). Scyphostatin inhibited SM/LCPL-PLC activities of the PfNSM product as well as the intraerythrocytic proliferation of P. falciparum in a dose-dependent manner with ID(50) values for SM/LCPL-PLC activities and the parasite growth at 3-5 microM and approximately 7 microM, respectively. Morphological analysis demonstrated most severe impairment in the intraerythrocytic development with the addition of scyphostatin at trophozoite stage than at ring or schizont stages, suggesting its effect specifically on the stage progression from trophozoite to schizont, coinciding with the active transcription of PfNSM gene.


Figures

Figure 1.
Figure 1.
Primary structure of P. falciparum SM/LCPL-PLC. (A) Deduced amino acid sequence of P. falciparum SM/LCPL-PLC. (B) Hydropathy profile of the deduced PfNSM product obtained using Kite-Doolittle algorithm with a window size of nineteen (reference 35). (C) Intracellular distribution of GST-PfNSMase expressed in E. coli. After centrifugation at 105 g for 1 h, E. coli cell lysates transfected with pGEX-PfNSM (lanes 1 and 2) or pGEX-PfNSMd(2/68) (lanes 3 and 4), were analyzed by Western blotting using anti-PfNSMase antibodies. Lanes 1 and 3, supernatant; lanes 2 and 4, pellet fraction. 2 μg protein was loaded in each lane. (D) Multiple sequence alignment of the SMases from different species. Sequence alignments were performed with CLUSTAL W (reference 47) and refined with GeneAlign program (reference 48) using amino acid sequences in the regions where significant homology was observed through the dotplot analysis. The regions in each amino acid sequence used are PFAL (P. falciparum), 182–278; BCER (B. cereus), 129–225; SAUR (S. aureus), 134–230; LINT (L. interrogans), 179–275; HSAP1 (Homo sapiens), 81–181; and HSAP2 (Homo sapiens), 406–513. Amino acid residues conserved in all species and more than four species are highlighted in black and gray, respectively. (E) Phylogenetic tree of SMases. The multiple sequence alignment shown in D was used to make the phylogenetic tree through neighbor-joining algorithm with MEGA version 2.2 (reference 38). Scale bar indicates the number of substitutions per site. Bootstrap values are percentages of 1,000 replications and are shown at the nodes. GenBank/EMBL/DDBJ accession no. for each SMase is in parentheses. UPGMA also gave similar phylogenetic tree with similar topology.
Figure 1.
Figure 1.
Primary structure of P. falciparum SM/LCPL-PLC. (A) Deduced amino acid sequence of P. falciparum SM/LCPL-PLC. (B) Hydropathy profile of the deduced PfNSM product obtained using Kite-Doolittle algorithm with a window size of nineteen (reference 35). (C) Intracellular distribution of GST-PfNSMase expressed in E. coli. After centrifugation at 105 g for 1 h, E. coli cell lysates transfected with pGEX-PfNSM (lanes 1 and 2) or pGEX-PfNSMd(2/68) (lanes 3 and 4), were analyzed by Western blotting using anti-PfNSMase antibodies. Lanes 1 and 3, supernatant; lanes 2 and 4, pellet fraction. 2 μg protein was loaded in each lane. (D) Multiple sequence alignment of the SMases from different species. Sequence alignments were performed with CLUSTAL W (reference 47) and refined with GeneAlign program (reference 48) using amino acid sequences in the regions where significant homology was observed through the dotplot analysis. The regions in each amino acid sequence used are PFAL (P. falciparum), 182–278; BCER (B. cereus), 129–225; SAUR (S. aureus), 134–230; LINT (L. interrogans), 179–275; HSAP1 (Homo sapiens), 81–181; and HSAP2 (Homo sapiens), 406–513. Amino acid residues conserved in all species and more than four species are highlighted in black and gray, respectively. (E) Phylogenetic tree of SMases. The multiple sequence alignment shown in D was used to make the phylogenetic tree through neighbor-joining algorithm with MEGA version 2.2 (reference 38). Scale bar indicates the number of substitutions per site. Bootstrap values are percentages of 1,000 replications and are shown at the nodes. GenBank/EMBL/DDBJ accession no. for each SMase is in parentheses. UPGMA also gave similar phylogenetic tree with similar topology.
Figure 2.
Figure 2.
Stage-specific transcription of PfNSMase in the intraerythrocytic parasite P. falciparum. (A) Northern blotting of asynchronous parasite culture. 10 μg of total RNA prepared from asynchronous cultures of three P. falciparum lines was loaded in each lane. The ethidium bromide-stained gel (lanes 1–3) shows the comparable loadings of RNA. Lane 1 and 4, 3D7; lane 2 and 5, Honduras-1; lane 3 and 6, Dd2. The position of the standard RNA marker (GIBCO BRL) is shown at the left. The stage distribution for each line is indicated: 3D7, 63% ring, 26% trophozoite, 11% schizont; Honduras-1, 71% ring, 22% trophozoite, 7% schizont; and Dd2, 48% ring, 26% trophozoite, 26% schizont. (B) Northern blotting of synchronous parasite culture. 4 μg (lanes 1, 2, 5, and 6) and 10 μg (lanes 3, 4, 7, and 8) of total RNA prepared from different stages of tightly synchronized culture of HB3 line was loaded. The ethidium bromide–stained gel (lanes 1–4) indicates the comparable loadings of RNA from the different stages at two different concentrations. Lanes 1, 3, 5, and 7, ring-rich culture (99% ring, 1% trophozoite, 0% schizont); lanes 2, 4, 6, and 8, trophozoite- and schizont-rich culture (0% ring, 86% trophozoite, 14% schizont). The position of the standard RNA marker is shown at the left. (C) RT-PCR experiment. PCR products obtained from different concentrations of first strand cDNA from various stages of tightly synchronized parasite culture of Honduras-1 line were analyzed in 0.8% agarose gel. Lanes 1 and 2, 3 and 4, 5–9, 10–14, and 15–19 are products obtained from ring, young trophozoite, mature trophozoite, schizont, and segmented-schizont, respectively. Parasite morphology at each stage used is shown on top. Dilution factors of the first strand cDNA solution are as follows: lanes 1, 2, 3, 5, 10, and 15, no dilution; lanes 4, 6, 11, and 16, 10-fold; lanes 7, 12, and 17, 100-fold; lanes 8, 13, and 18, 1,000-fold; lanes 9, 14, and 19, 10,000-fold.
Figure 3.
Figure 3.
LCPL-PLC activity in the membrane fraction of E. coli cells transfected with pGEX-PfNSM. (A) LysoPtdCho-, lysoPAF-, and PAF-PLC activities. Membranes (5 μg protein) from E. coli cells transfected with the indicated plasmids were incubated in 50 μl HM buffer (50 mM Hepes-NaOH, pH 7.5, and 10 mM MgCl2) containing 10 μM of various radioactive substrates at 37°C for 30 min. The amount of hydrolyzed substrates was determined as described under Materials and Methods. The data are means ± SD from three experiments. (B) Competition of lysoPtdCho-PLC activity with various lipids. The membrane fraction from pGEX-PfNSM-transfected E. coli (5 μg protein) was incubated in 50 μl of 50 mM Hepes-NaOH (pH 7.5) containing 10 mM MgCl2, 10 μM [palmitoyl-1-14C]lysoPtdCho, and various concentrations of nonradioactive competitors at 37°C for 30 min. The radioactivity of monopalmitoylglycerol produced was determined as described under Materials and Methods. The data shown are the percentages of the mean activity determined in the absence of competitors. Filled circles, lysoPtdCho; open circles, lysoPAF, filled squares, PAF; open squares, sphingosylphosphocholine; filled triangles, lysoPtdSer; open triangles, lysophosphatidylinositol.
Figure 4.
Figure 4.
Effect of scyphostatin on SM/LCPL-LPC activity. Membrane fraction prepared from GST-PfNSMase-expressing E. coli and bovine brain (0.5 mg protein/ml each) was incubated with various concentrations of scyphostatin in HSEI buffer for 30 min on ice. SMase activity of plasmodial (filled circles) and mammalian enzyme (open circles) was determined in the presence of 0.1% Triton X-100, and activities of lysoPtdCho-PLC (filled squares) and lysoPAF-PLC (filled triangles) were determined under detergent-free conditions as described under Materials and Methods. The values of the activity are shown as the percentage of the control activity determined in the absence of the drug.
Figure 5.
Figure 5.
Parasite growth inhibition by scyphostatin. (A) In vitro susceptibility of parasite lines to scyphostatin in a standard medium. The values are expressed as the percentage of the [3H]hypoxanthine incorporation into parasites treated with scyphostatin over those without treatment. The DMSO content in the assay media did not exceed 0.6%, which did not show any effect on the [3H]hypoxanthine incorporation into parasites. The mean values of triplicates from two independent experiments were used for each plot. Filled circles, 3D7; filled triangle, Honduras-1; filled squares, FCR3. (B) In vitro susceptibility of Honduras-1 line to scyphostatin (circles) or PPMP (triangles) in a serum-free medium was examined through either [3H]hypoxanthine incorporation assay (filled symbols) or microscopic assay (open symbols).
Figure 6.
Figure 6.
Effect of scyphostatin and PPMP on the intraerythrocytic development of Plasmodium falciparum. Parasite cells were treated with 1 μM scyphostatin or 5 μM PPMP at different stages. Lane 1, control medium containing 0.1% DMSO; lanes 2, 4, 6, 8, 10, and 12, medium containing 1 μM scyphostatin; lanes 3, 5, 7, 9, 11 and 13, medium containing 5 μM PPMP. The parasite culture was transferred from the control medium into the medium containing inhibitor in place of DMSO at 24 h (lanes 4 and 5), 28 h (lanes 6 and 7), 32 h (lanes 8 and 9), 36 h (lanes 10 and 11), and 40 h (lanes 12 and 13). Each panel shows the major morphology of the intraerythrocytic parasite in each treatment at the indicated time. Inset shows the other morphology that when observed, comprises >50% of the major one. However, in some occasions, no major morphology was observed. The percentage indicated at the left is the parasitemia of newly formed rings at 52 h. Mean values from duplicate slides are shown, results are reproducible based on two independent experiments.

Similar articles

Cited by

References

    1. van Deenen, L.L.M., and J. de Gier. 1974. Lipids of the red cell membrane. The Red Blood Cell. D.M. Surgenor, editor. Academic Press, New York. 147–211.
    1. Holz, G.G., Jr. 1977. Lipids and the malaria parasite. Bull. World Health Organ. 55:237–248. - PMC - PubMed
    1. Sherman, I.W. 1979. Biochemistry of Plasmodium (malarial parasites). Microbiol. Rev. 43:453–495. - PMC - PubMed
    1. Atkinson, C.T., and M. Aikawa. 1990. Ultrastructure of malaria-infected erythrocytes. Blood Cells. 16:351–368. - PubMed
    1. Vial, H.J., and M.L. Ancelin. 1998. Malarial lipids. Malaria: Parasite Biology, Pathogenesis, and Protection. I.W. Sherman, editor. ASM Press, Washington, D.C. 159–175.

Publication types

MeSH terms