. 2002 Jan 7;195(1):113-23.
doi: 10.1084/jem.20010956.

Identification of HLA-A2-restricted CD8(+) cytotoxic T cell responses in primary biliary cirrhosis: T cell activation is augmented by immune complexes cross-presented by dendritic cells

Affiliations

Identification of HLA-A2-restricted CD8(+) cytotoxic T cell responses in primary biliary cirrhosis: T cell activation is augmented by immune complexes cross-presented by dendritic cells

Hiroto Kita et al. J Exp Med. .

Abstract

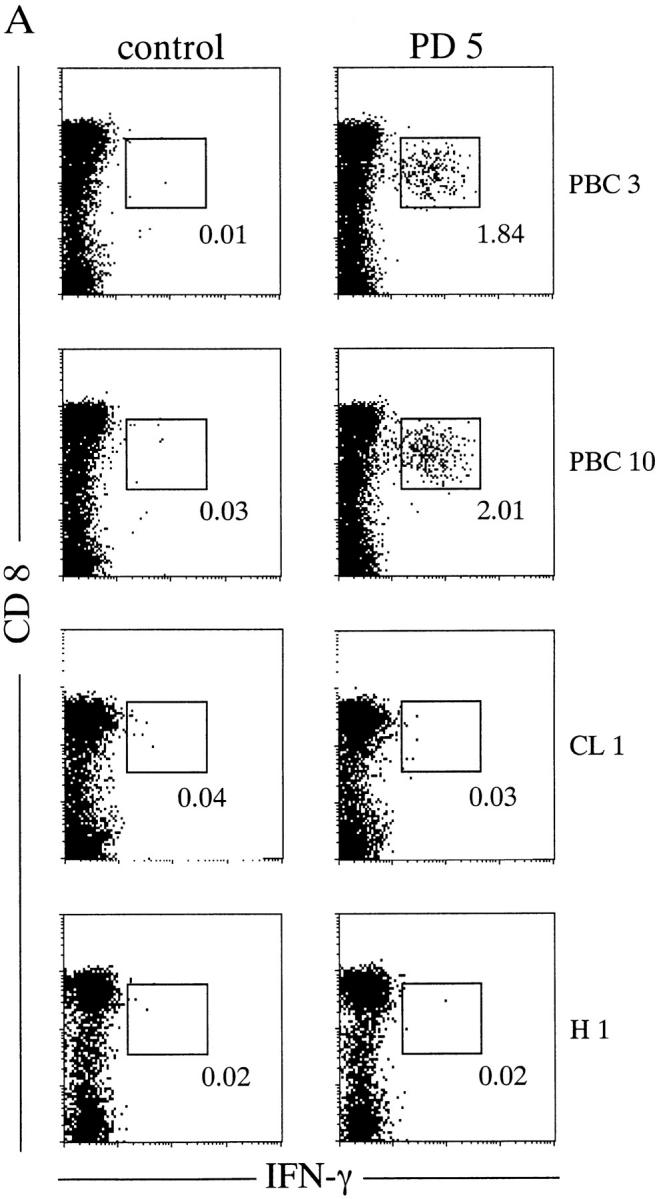
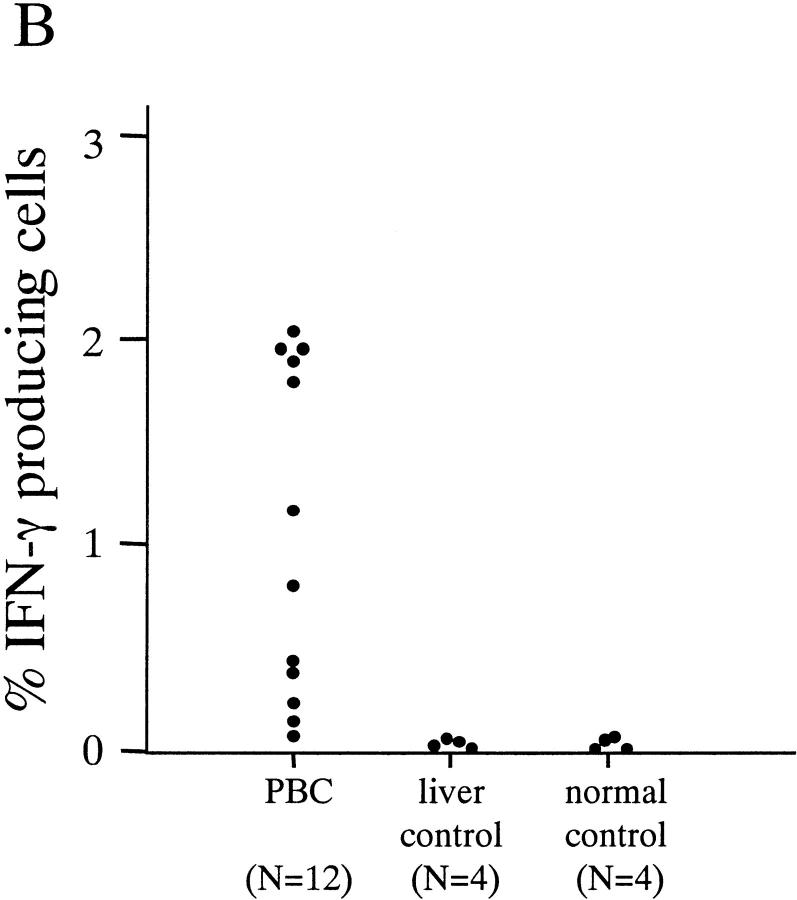
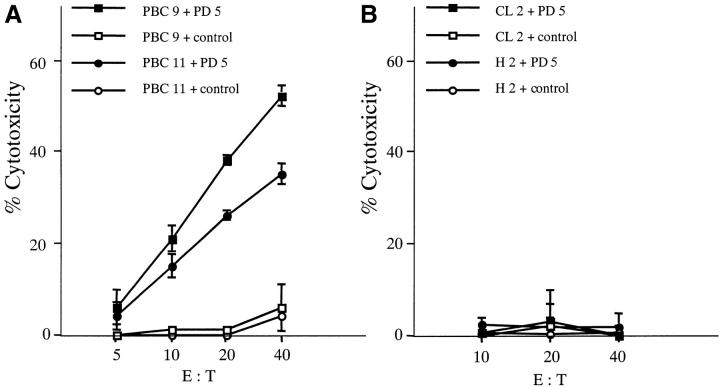
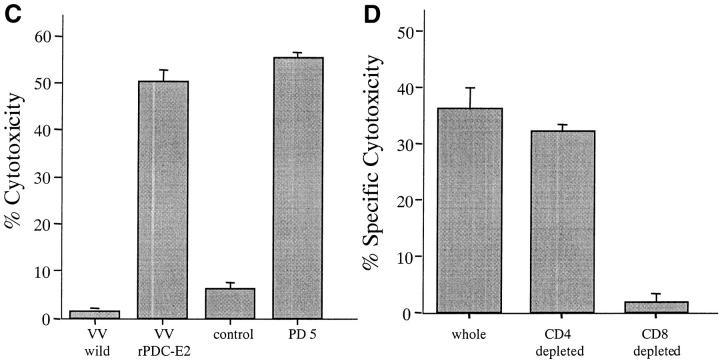
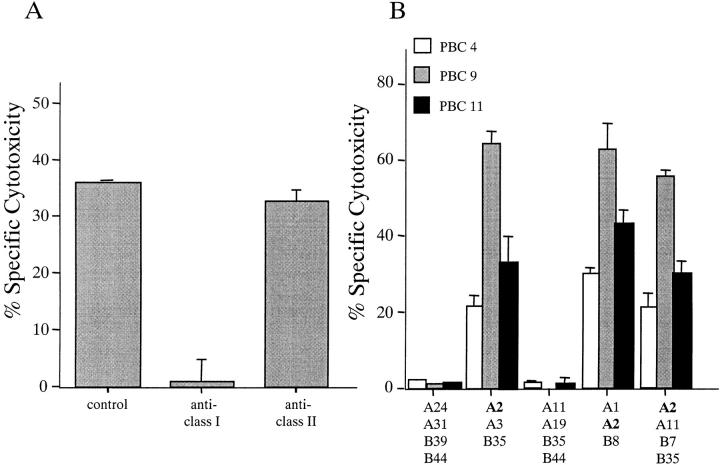
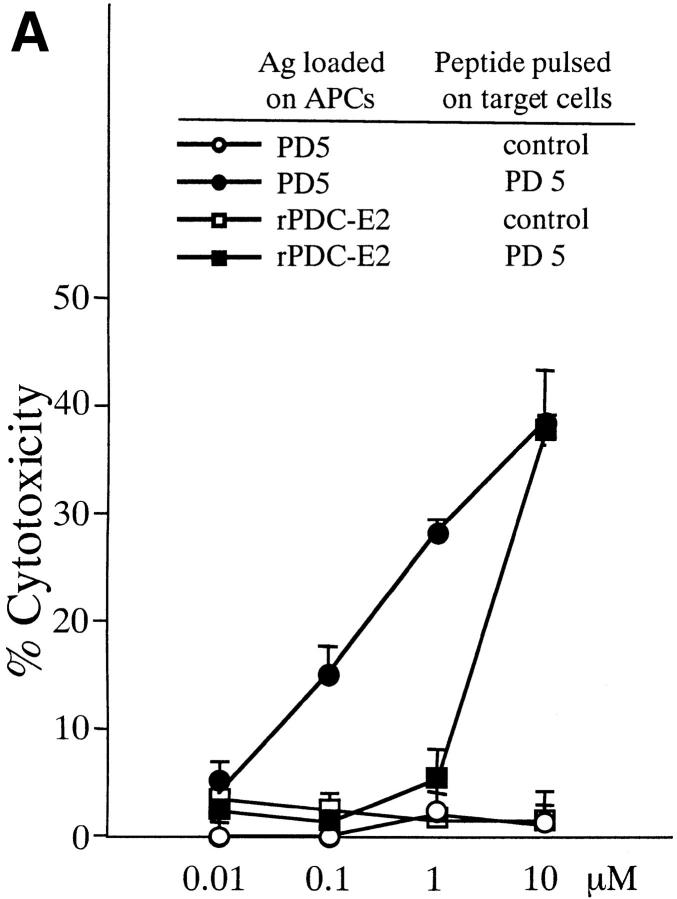
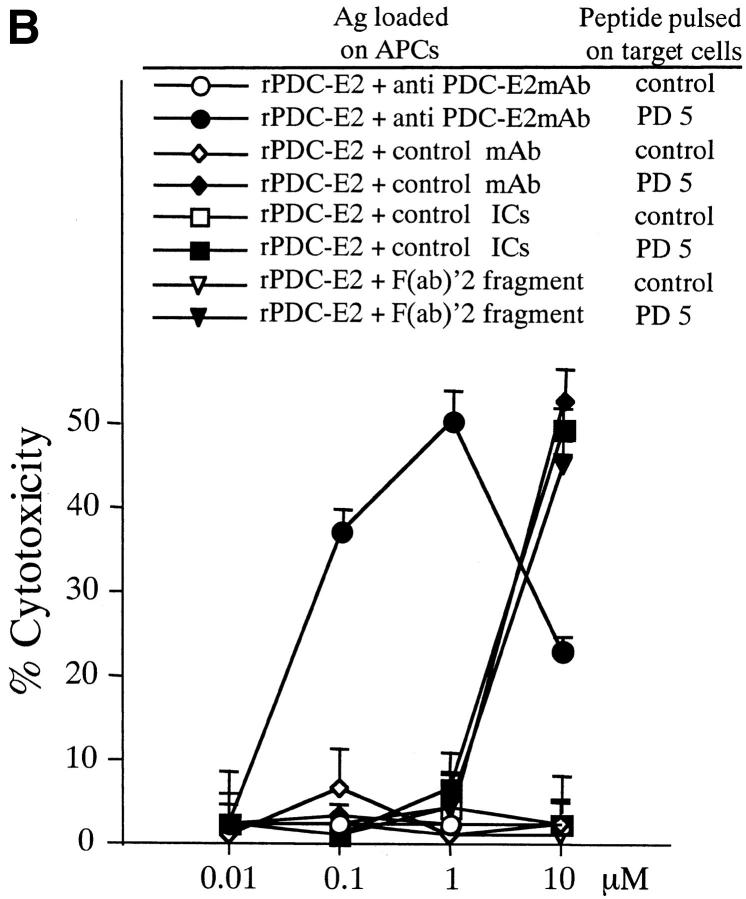
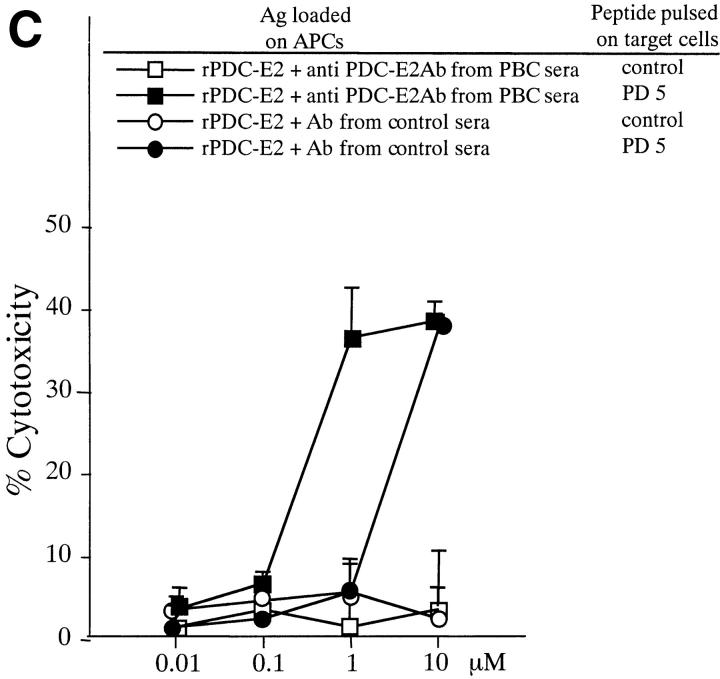
Primary biliary cirrhosis (PBC) is characterized by an intense biliary inflammatory CD4(+) and CD8(+) T cell response. Very limited information on autoantigen-specific cytotoxic T lymphocyte (CTL) responses is available compared with autoreactive CD4(+) T cell responses. Using peripheral blood mononuclear cells (PBMCs) from PBC, we identified an HLA-A2-restricted CTL epitope of the E2 component of pyruvate dehydrogenase (PDC-E2), the immunodominant mitochondrial autoantigen. This peptide, amino acids 159-167 of PDC-E2, induces specific MHC class I-restricted CD8(+) CTL lines from 10/12 HLA-A2(+) PBC patients, but not controls, after in vitro stimulation with antigen-pulsed dendritic cells (DCs). PDC-E2-specific CTLs could also be generated by pulsing DCs with full-length recombinant PDC-E2 protein. Furthermore, using soluble PDC-E2 complexed with either PDC-E2-specific human monoclonal antibody or affinity-purified autoantibodies against PDC-E2, the generation of PDC-E2-specific CTLs, occurred at 100-fold and 10-fold less concentration, respectively, compared with soluble antigen alone. Collectively, these data demonstrate that autoantibody, helper, and CTL epitopes all contain a shared peptide sequence. The finding that autoantigen-immune complexes can not only cross-present but also that presentation of the autoantigen is of a higher relative efficiency, for the first time defines a unique role for autoantibodies in the pathogenesis of an autoimmune disease.


Figures

Figure 1.
Figure 1.
PD5-specific CD8+ T cells from in vitro–cultured PBMCs. PBMCs from HLA-A2+ donors were cocultured with PD5-loaded APCs (autologous immature DCs) for 12 d, then restimulated with PD5 or a control peptide in the presence of brefeldin A, followed by intracellular staining for IFN-γ. (A) IFN-γ staining of samples from two PBC patients, PBC3 and PBC10, and two control donors, CL1 (alcoholic liver disease) and H1 (a healthy donor). Displayed in the dot plots are cells gated for lymphocyte population by forward-scattering and side-scattering and the CD4 population. The cells within the box are considered IFN-γ+. The number next to the box is the percentage of IFN-γ+ cells in the CD8+ T cell population. (B) Frequency of PD5-specific CD8+ T cells in PD5-stimulated PBMC cultures derived from all 20 donors. The cut off value for a positive response was determined as 0.150%, or 3 SD above the mean percentage of IFN-γ producing cells in all 20 samples restimulated with the control peptide. A significant number of IFN-γ–producing cells were detected after restimulation with PD5 in 10/12 (83%) PBC patients but in 0/8 control individuals (P < 0.0007).
Figure 1.
Figure 1.
PD5-specific CD8+ T cells from in vitro–cultured PBMCs. PBMCs from HLA-A2+ donors were cocultured with PD5-loaded APCs (autologous immature DCs) for 12 d, then restimulated with PD5 or a control peptide in the presence of brefeldin A, followed by intracellular staining for IFN-γ. (A) IFN-γ staining of samples from two PBC patients, PBC3 and PBC10, and two control donors, CL1 (alcoholic liver disease) and H1 (a healthy donor). Displayed in the dot plots are cells gated for lymphocyte population by forward-scattering and side-scattering and the CD4 population. The cells within the box are considered IFN-γ+. The number next to the box is the percentage of IFN-γ+ cells in the CD8+ T cell population. (B) Frequency of PD5-specific CD8+ T cells in PD5-stimulated PBMC cultures derived from all 20 donors. The cut off value for a positive response was determined as 0.150%, or 3 SD above the mean percentage of IFN-γ producing cells in all 20 samples restimulated with the control peptide. A significant number of IFN-γ–producing cells were detected after restimulation with PD5 in 10/12 (83%) PBC patients but in 0/8 control individuals (P < 0.0007).
Figure 2.
Figure 2.
Cytotoxicity of PD5-induced CTL lines. PD5-specific CTL lines, induced by culturing PBMCs with PD5-loaded APCs for 12–14 d, were tested for their cytotoxicity against PD5 or control peptide-loaded autologous BCL targets at different effector/target (E/T) ratios. HBc18–27, an HLA-A2-restricted irrelevant epitope, was used as control. Displayed are mean specific lysis of triplicate cultures. (A) PBC patients PBC9 and PBC11. (B) Control donors CL2 (granulomatous liver disease) and H2 (healthy donor). (C) Cytotoxic activity of a PD5-induced CTL line against target cells presenting endogenously processed PDC-E2 Ag. The CTL line from patient PBC1 was tested for cytotoxicity against autologous BCL targets infected with a PDC-E2–expressing vaccinia vector (VVrPDC-E2), wild-type vaccinia virus (VVwild) alone, loaded with PD5 or a control peptide HBc18–27. Displayed are mean specific lysis of triplicate testing at an E/T ratio of 40:1. (D) Phenotype analysis of PD5-induced CTLs. CD4+ cell or CD8+ cells were depleted respectively from a CTL line derived from patient PBC2 using anti-CD4 or anti-CD8–coated magnetic beads before testing for cytotoxic activity with PD5 or control peptide-loaded autologous BCL targets. Unfractionated cells were also tested in parallel. Specific cytotoxicity was calculated by subtracting the cytotoxicity of the effector cells against control peptide-pulsed BCLs from that against PD5 peptide-pulsed BCLs. Displayed are mean specific lysis of triplicate testing at an E/T ratio of 40:1 according to the cell counts before depletion.
Figure 2.
Figure 2.
Cytotoxicity of PD5-induced CTL lines. PD5-specific CTL lines, induced by culturing PBMCs with PD5-loaded APCs for 12–14 d, were tested for their cytotoxicity against PD5 or control peptide-loaded autologous BCL targets at different effector/target (E/T) ratios. HBc18–27, an HLA-A2-restricted irrelevant epitope, was used as control. Displayed are mean specific lysis of triplicate cultures. (A) PBC patients PBC9 and PBC11. (B) Control donors CL2 (granulomatous liver disease) and H2 (healthy donor). (C) Cytotoxic activity of a PD5-induced CTL line against target cells presenting endogenously processed PDC-E2 Ag. The CTL line from patient PBC1 was tested for cytotoxicity against autologous BCL targets infected with a PDC-E2–expressing vaccinia vector (VVrPDC-E2), wild-type vaccinia virus (VVwild) alone, loaded with PD5 or a control peptide HBc18–27. Displayed are mean specific lysis of triplicate testing at an E/T ratio of 40:1. (D) Phenotype analysis of PD5-induced CTLs. CD4+ cell or CD8+ cells were depleted respectively from a CTL line derived from patient PBC2 using anti-CD4 or anti-CD8–coated magnetic beads before testing for cytotoxic activity with PD5 or control peptide-loaded autologous BCL targets. Unfractionated cells were also tested in parallel. Specific cytotoxicity was calculated by subtracting the cytotoxicity of the effector cells against control peptide-pulsed BCLs from that against PD5 peptide-pulsed BCLs. Displayed are mean specific lysis of triplicate testing at an E/T ratio of 40:1 according to the cell counts before depletion.
Figure 3.
Figure 3.
(A) Inhibition of CTL activity by HLA class I and HLA class II (DR) mAbs. A CTL line derived from patient PBC5 was tested for cytotoxicity against PD5 or control peptide-loaded autologous BCL targets in the presence of predetermined optimal concentrations of Abs against different HLA molecules. Ab against HLA class I (W6/32), HLA class II DR (TAL.1B5; Dako) or a control Ab (mouse IgG2a; Caltag) were added respectively to the peptide-loaded targets and incubated for 30 min at 4°C. After the incubation the target cells were mixed with effector cells for EuTDA release assay. The CTL assays were performed at an E/T ratio of 40:1. Specific cytotoxicity was calculated by subtracting the cytotoxicity of the effector cells against control peptide-pulsed BCLs from that against PD5 peptide-pulsed BCLs. Displayed are mean specific lysis of triplicate testing. (B) HLA restriction of the PD5 epitope. CTL lines derived from three PBC patients were tested for cytotoxicity against PD5 or control peptide-loaded allogeneic BCLs derived from five individuals with distinct combinations of HLA haplotypes. The CTL assays were performed at an E/T ratio of 40:1. Specific cytotoxicity was calculated by subtracting the cytotoxicity of the effector cells against control peptide-pulsed BCLs from that against PD5 peptide-pulsed BCLs. Displayed are mean specific lysis of triplicate testing.
Figure 4.
Figure 4.
Induction of PD5-specific CTL lines with peptide, exogenous rPDC-E2 protein, or rPDC-E2 complexed with specific Abs. The cytotoxicity of CTL lines generated with the different Ags was tested against autologous BCL targets loaded with PD5 or control peptide at an E/T ratio of 40. (A) PBMCs from patient PBC10 were cocultured for 12 d with APCs loaded with rPDC-E2 protein or PD5 peptide at serial concentrations as indicated. (B) PBMCs from patient PBC9 were cocultured for 12 d with APCs loaded with serial concentrations of rPDC-E2 protein (as indicated) mixed with either human anti–PDC-E2 mAb, a control mAb, control ICs, or F(ab)′2 fragment of the human anti–PDC-E2 mAb. (C) PBMCs from patient PBC11 were cocultured for 12 d with APCs loaded with serial concentrations of rPDC-E2 protein (as indicated) mixed with affinity purified autoAbs from PBC sera or control Abs.
Figure 4.
Figure 4.
Induction of PD5-specific CTL lines with peptide, exogenous rPDC-E2 protein, or rPDC-E2 complexed with specific Abs. The cytotoxicity of CTL lines generated with the different Ags was tested against autologous BCL targets loaded with PD5 or control peptide at an E/T ratio of 40. (A) PBMCs from patient PBC10 were cocultured for 12 d with APCs loaded with rPDC-E2 protein or PD5 peptide at serial concentrations as indicated. (B) PBMCs from patient PBC9 were cocultured for 12 d with APCs loaded with serial concentrations of rPDC-E2 protein (as indicated) mixed with either human anti–PDC-E2 mAb, a control mAb, control ICs, or F(ab)′2 fragment of the human anti–PDC-E2 mAb. (C) PBMCs from patient PBC11 were cocultured for 12 d with APCs loaded with serial concentrations of rPDC-E2 protein (as indicated) mixed with affinity purified autoAbs from PBC sera or control Abs.

Similar articles

Cited by

References

    1. Coppel, R.L., and M.E. Gershwin. 1995. Primary biliary cirrhosis: the molecule and the mimic. Immunol. Rev. 144:17–49. - PubMed
    1. Van de Water, J., S. Shimoda, Y. Niho, R. Coppel, A. Ansari, and M.E. Gershwin. 1997. The role of T cells in primary biliary cirrhosis. Seminars in Liver Disease. 17:105–113. - PubMed
    1. Sidney, J., S. Southwood, M.F. del Guercio, H.M. Grey, R.W. Chesnut, R.T. Kubo, and A. Sette. 1996. Specificity and degeneracy in peptide binding to HLA-B7-like class I molecules. J. Immunol. 157:3480–3490. - PubMed
    1. Sidney, J., H.M. Grey, S. Southwood, E. Celis, P.A. Wentworth, M.F. del Guercio, R.T. Kubo, R.W. Chesnut, and A. Sette. 1996. Definition of an HLA-A3-like supermotif demonstrates the overlapping peptide-binding repertoires of common HLA molecules. Hum. Immunol. 45:79–93. - PubMed
    1. Nayersina, R., P. Fowler, S. Guilhot, G. Missale, A. Cerny, H.J. Schlicht, A. Vitiello, R. Chesnut, J.L. Person, A.G. Redeker, et al. 1993. HLA A2 restricted cytotoxic T lymphocyte responses to multiple hepatitis B surface antigen epitopes during hepatitis B virus infection. J. Immunol. 150:4659–4671. - PubMed

Publication types

MeSH terms