. 2002 Jan 22;99(2):649-54.
doi: 10.1073/pnas.022373099. Epub 2002 Jan 8.

Transcription-coupled repair in RNA polymerase I-transcribed genes of yeast

Affiliations

Transcription-coupled repair in RNA polymerase I-transcribed genes of yeast

Antonio Conconi et al. Proc Natl Acad Sci U S A. .

Abstract

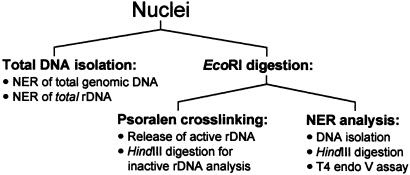
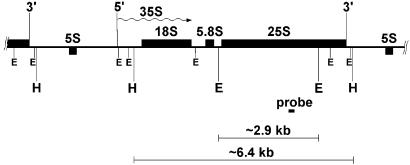
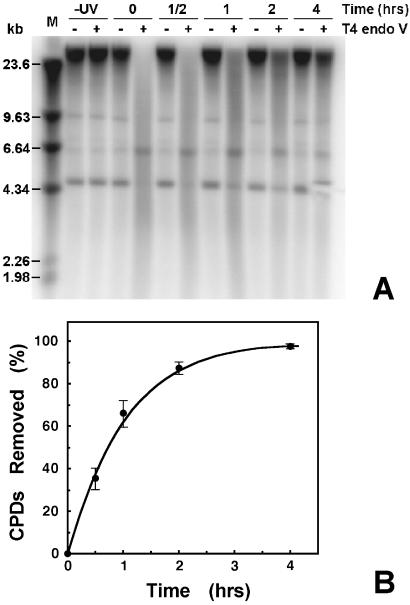
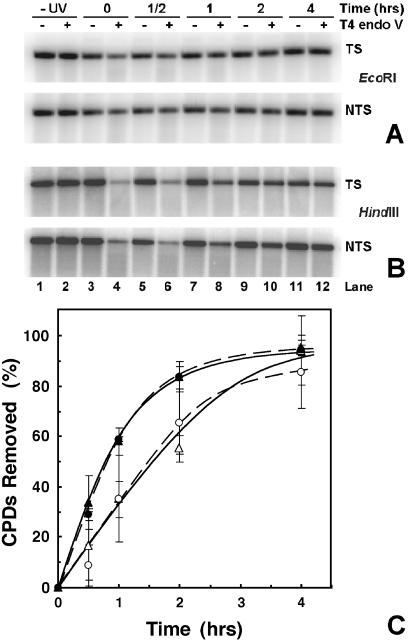
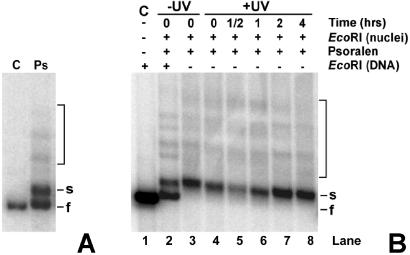
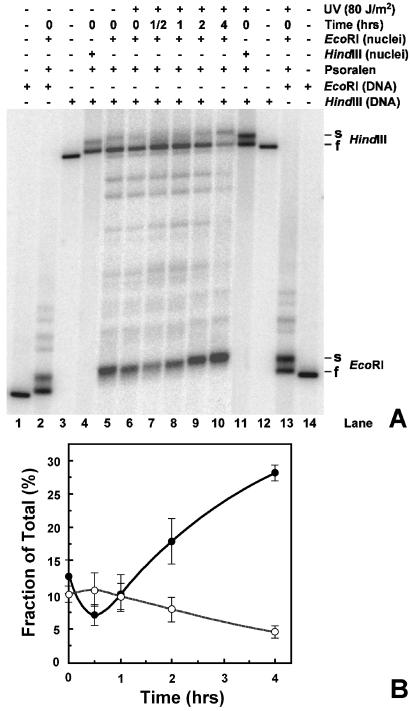
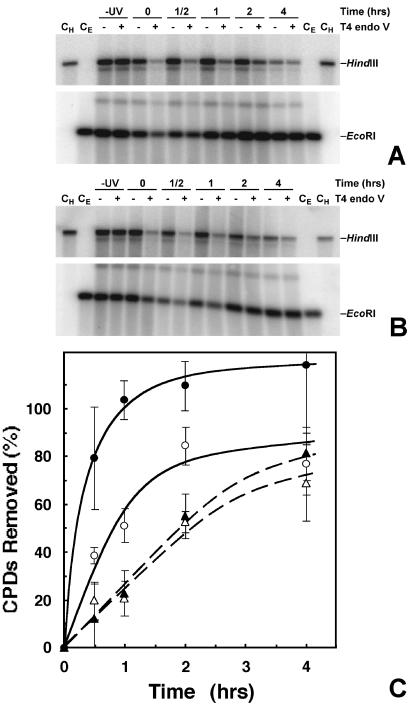
Nucleotide excision repair (NER) of UV-induced cyclobutane pyrimidine dimers (CPDs) was measured in the individual strands of transcriptionally active and inactive ribosomal genes of yeast. Ribosomal genes (rDNA) are present in multiple copies, but only a fraction of them is actively transcribed. Restriction enzyme digestion was used to specifically release the transcriptionally active fraction from yeast nuclei, and selective psoralen crosslinking was used to distinguish between active and inactive rDNA chromatin. Removal of CPDs was followed in both rDNA populations, and the data clearly show that strand-specific repair occurs in transcriptionally active rDNA while being absent in the inactive rDNA fraction. Thus, transcription-coupled repair occurs in RNA polymerase I-transcribed genes in yeast. Moreover, the nontranscribed strand of active rDNA is repaired faster than either strand of inactive rDNA, implying that NER has preferred access to the active, non-nucleosomal rDNA chromatin. Finally, restriction enzyme accessibility to active rDNA varies during NER, suggesting that there is a change in ribosomal gene chromatin structure during or soon after CPD removal.


Figures

Figure 1
Figure 1
Experimental design.
Figure 2
Figure 2
Map of the yeast 35S rRNA gene. The rRNA gene, 5′ and 3′ ends, and direction of transcription (wavy arrow) are shown. The short black box represents the probe (≈140 bp) used in this work. The EcoRI (E) and HindIII (H) restriction sites are indicated, together with the sizes of the restriction fragments (solid bars).
Figure 3
Figure 3
Repair of CPDs from total genomic DNA. Yeast cells were irradiated with 80 J/m2 UV and harvested at the times indicated. Total DNA was purified, treated with T4 endo V, and separated on 1% alkaline agarose gels. After blotting, filters were hybridized with random primer-labeled total genomic DNA. (A) Representative Southern blot. Repair times (in h) after UV irradiation are indicated above the lanes. Other labels are: −UV, DNA from unirradiated cells; − and +, samples mock-treated or treated with T4 endo V, respectively; and M, λ DNA digested with HindIII. (B) Percent of CPDs removed as a function of repair time. The number of CPDs present in genomic DNA at each time was determined as described (35). Data are the mean ± 1 SD of three independent experiments.
Figure 4
Figure 4
Repair of CPDs from total rDNA. DNA from cells, irradiated as in Fig. 3, was digested with either EcoRI or HindIII before treatment with T4 endo V. Filters were hybridized with strand-specific riboprobes. (A) PhosphorImage for the TS and NTS of EcoRI-digested total rDNA. (B) PhosphorImage for the TS and NTS of HindIII-digested total rDNA. Labeling of the gel is the same as in Fig. 3. (C) Quantification of PhosphorImages. DNA repair is expressed as percent of CPDs removed vs. repair time. Filled and empty symbols represent data for the TS and the NTS, respectively. Circles and dashed lines denote HindIII digests, and triangles and solid lines denote EcoRI digests. Data are the mean ± 1 SD of four independent experiments.
Figure 5
Figure 5
EcoRI digestion of nuclei. (A) DNA was extracted from cells treated (lane Ps) or untreated (lane C) with psoralen. After EcoRI digestion, DNA was separated on 1% native agarose gels, blotted, and hybridized with labeled rDNA probe. The s- (slow) and f- (fast) bands correspond to the active and inactive rDNA, respectively. (B) Nuclei were isolated from unirradiated (lane 3) or irradiated (lanes 4–8) cells, before (lane 4) and during NER (lanes 5–8). Nuclei were digested with EcoRI and then treated with psoralen (lanes 2–8). DNA was purified from the nuclei, and the DNA samples were separated by gel electrophoresis (lanes 3–8) or redigested with EcoRI before gel electrophoresis (lane 2). As control (C), DNA was isolated from uncrosslinked nuclei and digested with EcoRI (lane 1). The bracket indicates partial EcoRI digest bands.
Figure 6
Figure 6
Separation of active and inactive ribosomal chromatin. (A) Nuclei were isolated from unirradiated (lane 5) and irradiated (lanes 6–10) cells that were harvested after different repair times. These nuclei were digested with EcoRI before psoralen crosslinking (lanes 5–10). The isolated DNA was then digested with HindIII, separated on a 1% native agarose gel, blotted, and hybridized with labeled rDNA probe (see Fig. 2). As controls, genomic DNA was isolated from uncrosslinked cells and digested with either EcoRI (lanes 1 and 14) or HindIII (lanes 3 and 12). The presence of active and inactive rDNA chromatin was monitored by digesting nuclei with EcoRI or HindIII before psoralen crosslinking and by redigesting the isolated DNA with EcoRI and HindIII, respectively (lanes 2 and 13, and lanes 4 and 11). Labels on the right denote active rDNA, s- (slow) band, and inactive rDNA, f- (fast) band. (B) Signals of the EcoRI and HindIII bands in each lanes were quantified and expressed as percent of the total signal measured in the corresponding lanes. Data are the mean ± 1 SD of three independent experiments.
Figure 7
Figure 7
Repair of individual strands of active and inactive rDNA. After different repair times, DNA was isolated from EcoRI-treated nuclei and digested with HindIII. DNA samples, mock-treated or treated with T4 endo V, are denoted by − and +, respectively. −UV denotes nuclei from unirradiated cells, and +UV denotes nuclei from irradiated cells harvested after the indicated repair times. Samples were separated on a 1% alkaline agarose gel, blotted, and hybridized with strand-specific riboprobes (see Fig. 2). As controls, genomic DNA was isolated from nontreated cells and digested with either HindIII or EcoRI, respectively (CH and CE). (A) TS and (B) NTS. To conserve space, the central portion of each gel is not shown. (C) Quantification of PhosphorImages. DNA repair is expressed as percent of CPDs removed as a function of repair time. Data are from active rDNA (EcoRI, circles) and inactive rDNA (HindIII, triangles). Solid and open symbols represent data from the TS and NTS, respectively. Data are the mean ± 1 SD of three independent experiments.

References

    1. Freidberg E C, Walker G C, Siede W. DNA Repair and Mutagenesis. Washington, DC: Am. Soc. Microbiol. Press; 1995.
    1. Woodgate R. Genes Dev. 1999;13:2191–2195. - PubMed
    1. Vrieling H, van Zeeland A A, Mullenders L H. Mutat Res. 1998;400:135–142. - PubMed
    1. Tornaletti S, Hanawalt P C. Biochimie. 1999;81:139–146. - PubMed
    1. Mellon I, Spivak G, Hanawalt P C. Cell. 1987;51:241–249. - PubMed

Publication types

LinkOut - more resources