. 2002 Jan 22;99(2):691-6.
doi: 10.1073/pnas.022408799. Epub 2002 Jan 8.

Improved recognition of native-like protein structures using a family of designed sequences

Affiliations

Improved recognition of native-like protein structures using a family of designed sequences

Patrice Koehl et al. Proc Natl Acad Sci U S A. .

Abstract

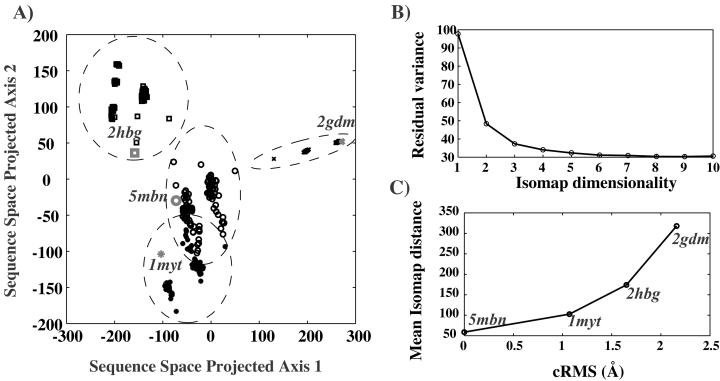
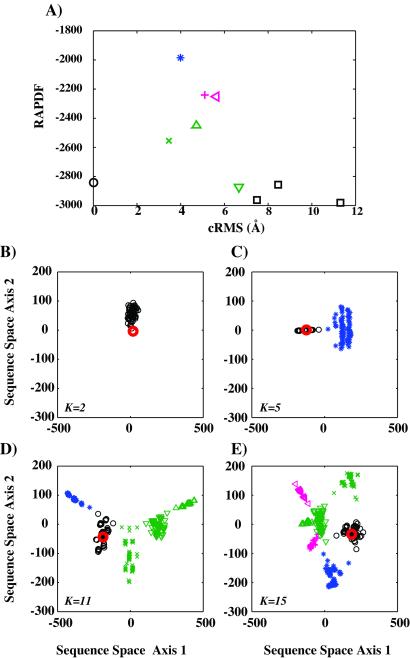
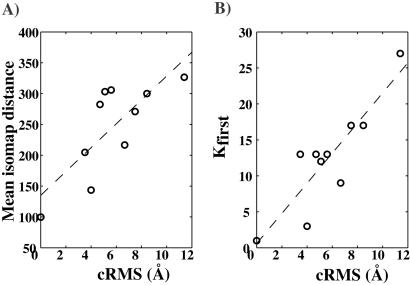
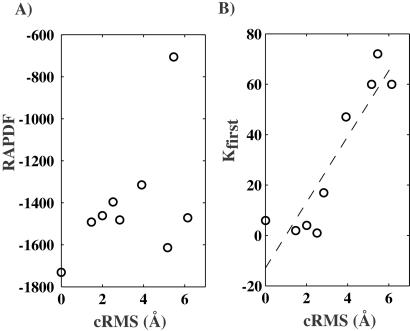
The goal of the inverse protein folding problem is to identify amino acid sequences that stabilize a given target protein conformation. Methods that attempt to solve this problem have proven useful for protein sequence design. Here we show that the same methods can provide valuable information for protein fold recognition and for ab initio protein structure prediction. We present a measure of the compatibility of a test sequence with a target model structure, based on computational protein design. The model structure is used as input to design a family of low free energy sequences, and these sequences are compared with the test sequence by using a metric in sequence space based on nearest-neighbor connectivity. We find that this measure is able to recognize the native fold of a myoglobin sequence among different globin folds. It is also powerful enough to recognize near-native protein structures among non-native models.


Figures

Figure 1
Figure 1
A well-characterized fold recognition problem involves the globin family. The restricted library of folds consists of four globins: two myoglobins (5mbn and 1myt), one hemoglobin (2hbg), and one leghemoglobin (2gdm). One hundred sequences are optimized for stability and specificity for each of the four proteins. The corresponding 400 sequences are pooled with the native sequences and given as input to isomap (41). The underlying distance for close neighbors in sequence space is D = 100 − I, where I is the percent sequence identity between the two sequences [computed on the basis of the structure alignment of their corresponding structures; we use structal (51) for protein structure superposition]. The neighborhood of each sequence includes its 40 closest sequences (i.e., K = 40; see text). (A) A two-dimensional projection of the sequence space spanned by these 404 sequences is shown. The designed sequences are shown in black with small marks (○ for 5mbn, * for 1myt, □ for 2hbg, and x for 2gdm), whereas the native sequences are shown in gray with large marks. The sequences are found in four clusters, each corresponding to one of the globin structures. The native sequence of each protein is found within, or very close to, the sequences designed for that protein. (B) The residual variance of the isomap embedding is plotted versus the dimensionality of the projection. The dimensionality of the sequence space covered by the four globins is estimated to be 2. (C) The mean isomap distance (for K = 40) between the native sequence of 5mbn and each family of sequences designed for the four globin structures is plotted versus the cRMS between the corresponding structure and 5mbn.
Figure 2
Figure 2
Recognition of native-like structures for 1ctf among nonnative models. (A) Ten model structures (including the native structure) were selected from the data set of 1,000 decoys generated by the group of David Baker for 1ctf (8). The RAPDF score of these 10 models is plotted versus cRMS. These models were chosen such that the all-atom potential of mean force RAPDF (25) fails to distinguish near-native from nonnative conformations. (BD) One hundred sequences were designed for each of the 10 models selected for 1ctf. The corresponding 1,000 sequences together with the native sequence of 1ctf are given as input to isomap. Two-dimensional embeddings of the sequence space covered by these 1,001 sequences are shown for the increasing value of K, the number of sequences that defines the neighborhood of each sequence in the underlying graph. The marks used to identify each sequence cluster are consistent with A. The native sequence is shown in red as a big circle (○). Note that the sequences designed for each particular model structure cluster in sequence space.
Figure 3
Figure 3
Plots of score versus cRMS for the data set of 10 models selected for 1ctf (see legend of Fig. 2). (A) The mean isomap distances (for K = 35) between the native sequence of 1ctf and the families of sequences designed for the model structures are plotted versus cRMS. A significant correlation of 0.77 is observed between these distances and cRMS for nonnative models. (B) The first value of K, Kfirst, for which a connection is observed between the family of sequences designed for a model structure, is plotted versus the cRMS of the model to the native structure of 1ctf. A significant correlation of 0.88 is observed between Kfirst and cRMS. The dotted lines in A and B show the best line fits to the data.
Figure 4
Figure 4
Recognition of native-like structures for 4rxn among nonnative models. (A) Nine model structures (including the native structure) were selected from the data set of 638 decoys generated by B. Park and M.L. (6). The RAPDF score of these 10 models is plotted versus cRMS. No correlation between the RAPDF score and cRMS is observed. (B) The first value of K, Kfirst, for which a connection is observed between the family of sequences designed for a model structure is plotted versus the cRMS of the model to the native structure of 4rxn. A significant correlation of 0.91 is observed between Kfirst and cRMS. The dotted line shows the best line fit to the data.

References

    1. Anfinsen C. Science. 1973;181:223–230. - PubMed
    1. Murzin A. Nat Struct Biol. 2001;8:110–112. - PubMed
    1. Chothia C, Lesk A. EMBO J. 1986;5:823–826. - PMC - PubMed
    1. Sander C, Schneider R. Proteins Struct Funct Genet. 1991;9:56–68. - PubMed
    1. Jones D T, Taylor W R, Thornton J M. Nature (London) 1992;358:86–89. - PubMed

Publication types

LinkOut - more resources