. 2002 Feb;22(3):816-34.
doi: 10.1128/MCB.22.3.816-834.2002.

Hsp27 as a negative regulator of cytochrome C release

Affiliations

Hsp27 as a negative regulator of cytochrome C release

Catherine Paul et al. Mol Cell Biol. 2002 Feb.

Abstract

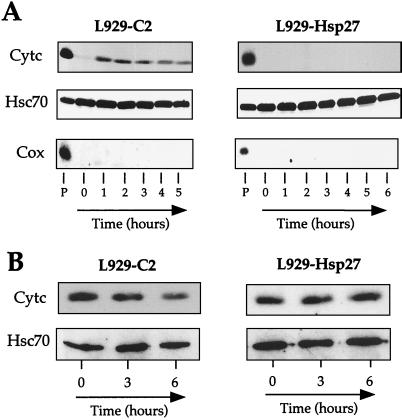
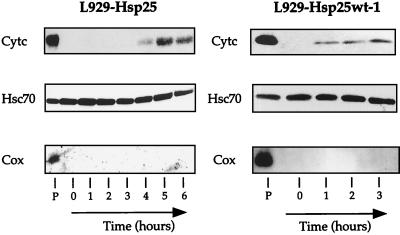
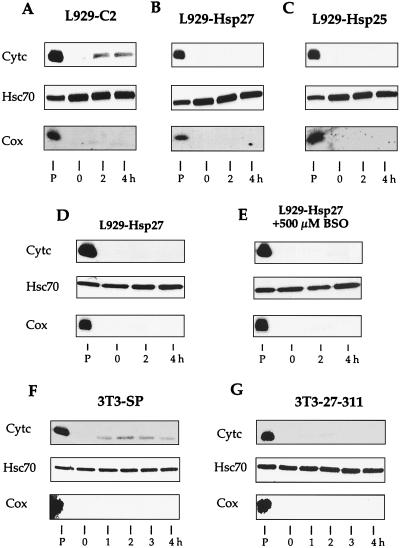
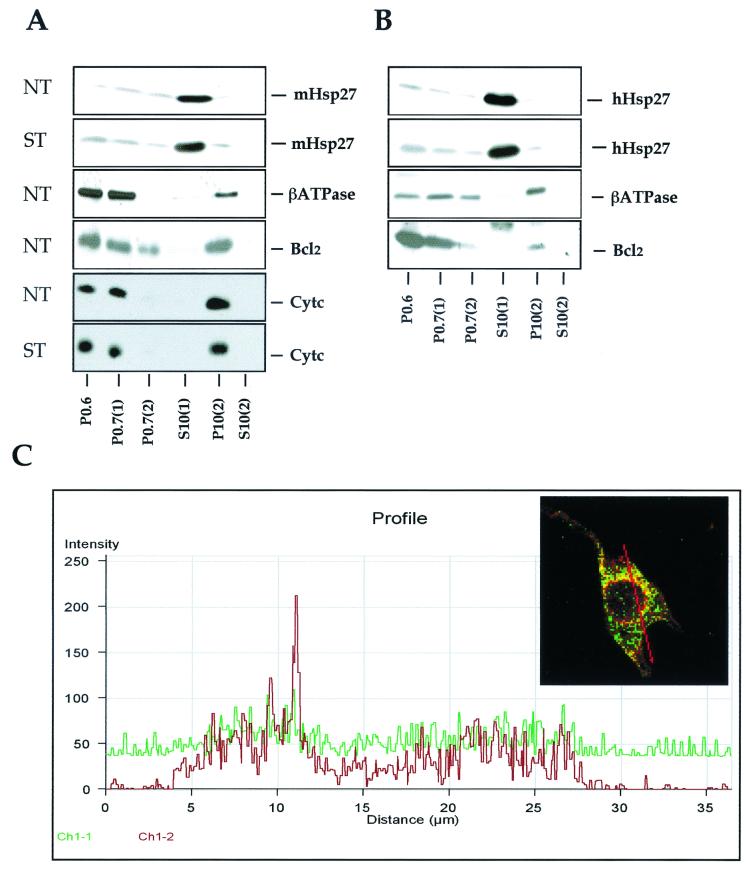
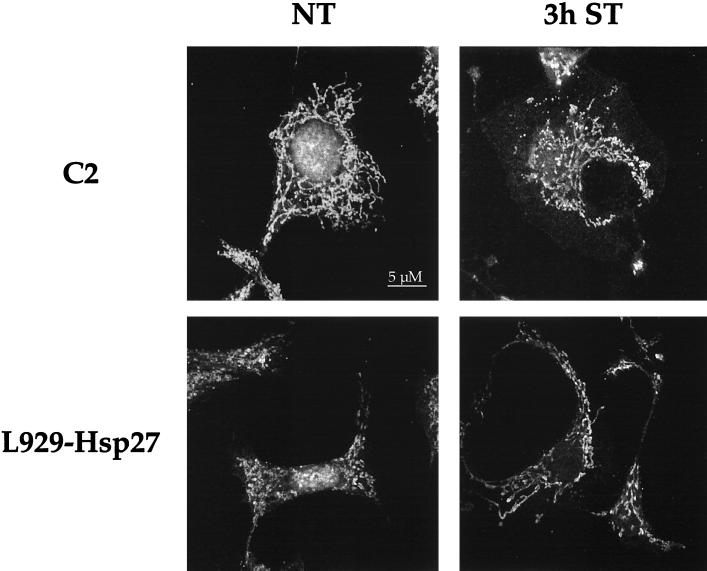
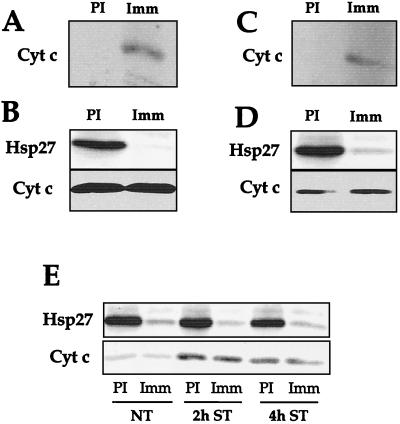
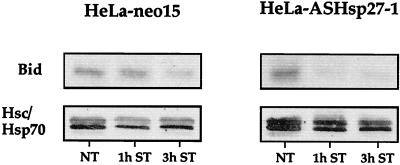
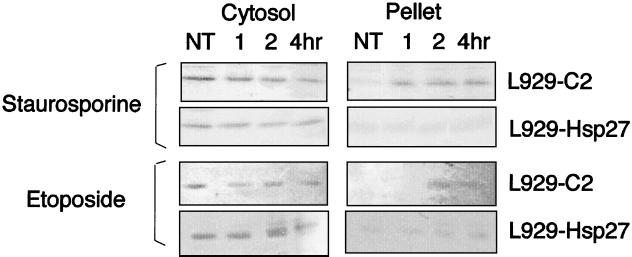
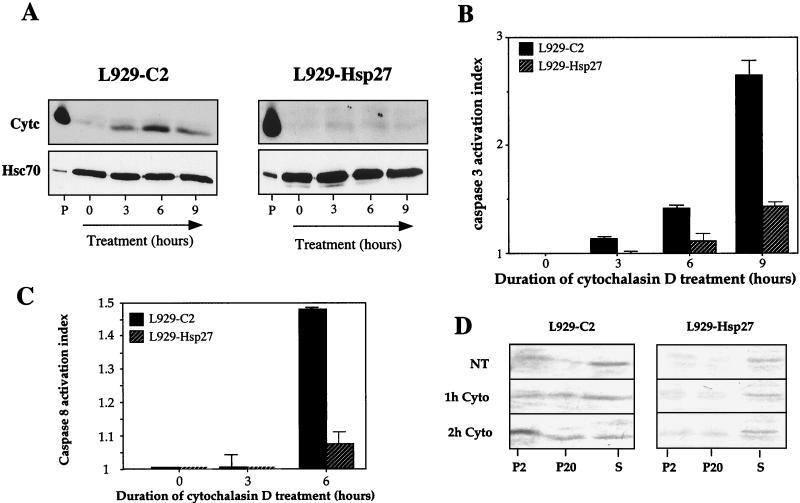
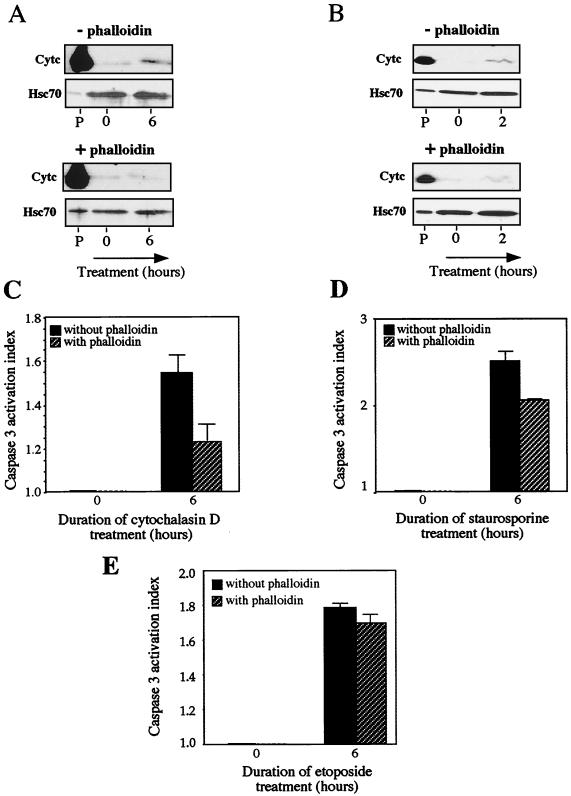
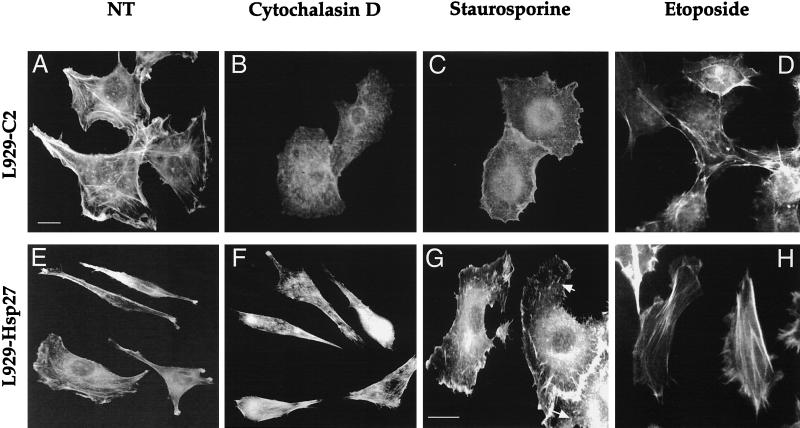
We previously showed that Hsp27 protects against apoptosis through its interaction with cytosolic cytochrome c. We have revisited this protective activity in murine cell lines expressing different levels of Hsp27. We report that Hsp27 also interferes, in a manner dependent on level of expression, with the release of cytochrome c from mitochondria. Moreover, a decreased level of endogenous Hsp27, which sensitized HeLa cells to apoptosis, reduced the delay required for cytochrome c release and procaspase 3 activation. The molecular mechanism regulating this function of Hsp27 is unknown. In our cell systems, Hsp27 is mainly cytosolic and only a small fraction of this protein colocalized with mitochondria. Moreover, we show that only a very small fraction of cytochrome c interacts with Hsp27, hence excluding a role of this interaction in the retention of cytochrome c in mitochondria. We also report that Bid intracellular relocalization was altered by changes in Hsp27 level of expression, suggesting that Hsp27 interferes with apoptotic signals upstream of mitochondria. We therefore investigated if the ability of Hsp27 to act as an expression-dependent modulator of F-actin microfilaments integrity was linked to the retention of cytochrome c in mitochondria. We show here that the F-actin depolymerizing agent cytochalasin D rapidly induced the release of cytochrome c from mitochondria and caspase activation. This phenomenon was delayed in cells pretreated with the F-actin stabilizer phalloidin and in cells expressing a high level of Hsp27. This suggests the existence of an apoptotic signaling pathway linking cytoskeleton damages to mitochondria. This pathway, which induces Bid intracellular redistribution, is negatively regulated by the ability of Hsp27 to protect F-actin network integrity. However, this upstream pathway is probably not the only one to be regulated by Hsp27 since, in staurosporine-treated cells, phalloidin only partially inhibited cytochrome c release and caspase activation. Moreover, in etoposide-treated cells, Hsp27 still delayed the release of cytochrome c from mitochondria and Bid intracellular redistribution in conditions where F-actin was not altered.


Figures

FIG. 1.
FIG. 1.
Characterization of staurosporine-resistant L929 cells expressing Hsp27. (A) Characterization of human Hsp27 (hHsp27) levels in L929-Hsp27 cells and murine Hsp27 (mHsp27) levels in L929-Hsp25 and L929-Hsp25wt-1 cells. Total cellular proteins were analyzed in immunoblots probed with antisera that recognized either hHsp27 or mHsp27 as outlined in Materials and Methods. L929-C2, control cells. (B) Activity of DEVD-specific caspases measured using the fluorescent substrate DEVD-AFC as described in Materials and Methods. The activation index was determined as the ratio between the activity in extracts of treated cells to that measured in extracts of nontreated cells. The histogram shown is representative of three identical experiments; standard deviations (error bars) are presented (n = 3). The insert shows caspase 8 activity measured using the fluorescent substrate IETD-AFC.
FIG. 2.
FIG. 2.
Human Hsp27 expression interferes with the accumulation of cytosolic cytochrome c in response to staurosporine treatment. Control (L929-C2) and human Hsp27-expressing (L929-Hsp27) cells were either kept untreated or treated for various times with 1 μM staurosporine. Cells were then harvested, lysed under conditions that kept mitochondria intact, and spun to obtain a supernatant (A) and a pellet fraction resulting from centrifugation at 14,000 × g (B) as described in Materials and Methods. The presence of cytochrome c (Cytc), Hsc70, and cytochrome oxidase (subunit II) (Cox) in the different fractions was determined by immunoblot analysis. Hsc70 was used as an internal marker of gel loading. Autoradiographs of ECL-revealed immunoblot are presented. Note that in human Hsp27-expressing cells, cytochrome c is not detectable in the supernatant and most of this protein remains associated with the pellet fraction. Lanes: P, pellet from untreated cells; 0 to 6, soluble fractions isolated from either untreated cells (0) or cells treated for the indicated number of hours with staurosporine.
FIG. 3.
FIG. 3.
Analysis of L929 cells expressing different levels of murine Hsp27. The interference with the accumulation of cytosolic cytochrome c depends on Hsp27 level. Murine Hsp27-expressing L929-Hsp25 and L929-Hsp25wt-1 cells were either kept untreated or treated for various times with 1 μM staurosporine. Cells were processed, and the presence of cytochrome c, Hsc70, and Cox was determined as described in the legend to Fig. 2. Only the immunoblot analysis of the supernatant fractions (1 to 6) and pellet fraction (P) isolated at time zero are presented. Note that the interference of Hsp27 with cytochrome c release is dependent on the level of expression of this stress protein.
FIG. 4.
FIG. 4.
Hsp27-mediated reduced accumulation of cytosolic cytochrome c is independent of apoptotic inducer, intracellular glutathione level, and cell line. (A to C) Analysis of cytochrome c release from mitochondria of control (L929-C2) (A), human Hsp27-expressing (L929-Hsp27) (B), and murine Hsp27-expressing (L929-Hsp25) (C) L929 cells treated for different times with 500 μM etoposide. (D and E) L929-Hsp27 cells exposed (E) or not (D) to 500 μM BSO for 18 h before being exposed (2 and 4 h) or not to 1 μM staurosporine. (F and G) Control (3T3-SP) (F) or human Hsp27-expressing (3T3-27-311) (G) NIH 3T3 cells either untreated or treated for various times with 1 μM staurosporine. Cells were lysed as described above in the legend to Fig. 2 and Materials and Methods to obtain a supernatant and pellet fraction. Cytochrome c, Hsc70, and Cox in the particulate and supernatant fractions were determined by immunoblot analysis using the corresponding antibodies. Autoradiographs of ECL-revealed immunoblot are presented. Lanes: P, pellet from untreated cells; 0 to 4, soluble fractions isolated from either untreated cells (0) or cells treated for the indicated number of hours with staurosporine or etoposide.
FIG. 5.
FIG. 5.
Underexpression of Hsp27 in HeLa cells stimulates the accumulation of cytosolic cytochrome c and caspase 3 activation. (A) Analysis of human Hsp27 level present in HeLa-neo15 and HeLa-ASHsp27-1 cells kept at 37°C or treated (HS) for 90 min at 43°C and allowed to recover for 16 h. (B) Analysis of the resistance of HeLa cell lines to staurosporine. Cells were plated in 96-well tissue culture plates and allowed to grow for an additional 24-h period before being treated for 18 h with increasing concentrations of staurosporine (0 to 0.25 μM). Cellular survival was determined by crystal violet assay as described in Materials and Methods. The values were normalized to 100% using the cells not treated with staurosporine. Standard deviations (error bars) are indicated (n = 3). (C and D) Immunoblot analysis of cytochrome c release in cytosol. HeLa-neo15 cells (C) and HeLa-ASHsp27-1 (D) cells either kept untreated or treated for various times with 0.125 μM staurosporine were lysed as described in the legend for Fig. 2 to obtain a supernatant and pellet fraction. Lanes: P, pellet from untreated cells; 0 to 5, soluble fractions isolated from either untreated cells (0) or cells treated for the indicated number of hours with staurosporine. Hsc70 was used as an internal marker of gel loading. (E) Activity of DEVD-specific caspases in HeLa-neo15 and HeLa-ASHsp27-1 cells exposed or not to 0.125 μM staurosporine. The caspase activation index was determined as the ratio between the activity in extracts of treated cells to that measured in extracts of nontreated cells. The histogram shown is representative of three identical experiments; standard deviations (error bars) are presented (n = 3). (F) Immunoblot analysis of caspase 3 cleavage. Total protein extracts from HeLa-neo15 and HeLa-ASHsp27-1 cells either kept untreated (0) or treated for various times (4 and 8 h) with 0.125 μM staurosporine were analyzed in immunoblots probed with anti-caspase 3 antiserum which recognizes the uncleaved from of procaspase 3 as well as the p17 cleavage product. Autoradiographs of ECL-revealed immunoblots are presented.
FIG. 6.
FIG. 6.
The majority of the cellular content of Hsp27 is localized in the soluble cytoplasm. (A) Analysis of murine Hsp27 intracellular localization. L929-Hsp25 cells, either grown under normal conditions (NT) or treated (ST) for 2 h with 1 μM staurosporine, were lysed and fractionated as described in Materials and Methods. Immunoblot analysis of the different subcellular fractions was performed with antisera that specifically recognize murine Hsp27, ATP synthase β subunit (βATPase), Bcl-2, and cytochrome c. (B) Same as panel A, but here the intracellular localization of human Hsp27 constitutively expressed in HeLa cells treated or not for 2 h with 0.125 μM staurosporine was analyzed. (C) Comparison of Hsp27 and mitochondrial localization by confocal microscopy analysis. Hsp27 and Cox fluorescence was analyzed in HeLa cells treated for 4 h with 0.125 μM staurosporine. Cells were stained for Hsp27 (green fluorescence) and Cox (red fluorescence) and processed for confocal analysis as described in Materials and Methods. The fusion image (merge) is shown. The graph represents the fluorescence distribution of Hsp27 (green; Ch1-1) and Cox (red; Ch1-2) determined for the section of the cell shown in the green/red fusion image. Results are representative of three independent experiments.
FIG. 7.
FIG. 7.
Confocal microscopy analysis of cytochrome c immunostaining in control and Hsp27-expressing L929 cells exposed or not to staurosporine. Control L929 cells (C2) and L929-Hsp27 cells were either kept untreated (NT) or treated for 3 h with 1 μM staurosporine (3 h ST). Cells were prepared for immunostaining analysis using anti-cytochrome c antibody and observed under a confocal fluorescence microscope as described in Materials and Methods.
FIG. 8.
FIG. 8.
Analysis of the interaction of Hsp27 with cytochrome c. (A) Immunoblot analysis of the proteins immunoprecipitated by anti-Hsp27 antibody. HeLa-neo15 cells, treated for 2 h with 0.125 μM staurosporine, were lysed in the presence of 0.1% NP-40 as described in Materials and Methods. This protocol destroyed mitochondria, leading most cytochrome c to be recovered in the soluble cell lysate. Immunoprecipitations were carried out with nonimmune (PI) or Hsp27 (Imm) antibody, and the immunoprecipitated proteins were analyzed in immunoblots probed with anti-cytochrome c antibody. Note that some endogenous cytochrome c coimmunoprecipitates with Hsp27. (B) Analysis of the relative fraction of endogenous cytochrome c that coimmunoprecipitates with Hsp27. HeLa-neo15 cells were treated and lysed in detergent, and immunoprecipitations carried out as above. In this case, the proteins present in the supernatants obtained from the immunoprecipitation step were analyzed in immunoblots probed with both Hsp27 and cytochrome c antisera. Note that no detectable decrease in the level of endogenous cytochrome c is observed after a complete immunodepletion of Hsp27. (C) Same as panel A, but in this case HeLa-ASHsp27-1 cells treated for 2 h with 0.125 μM staurosporine were lysed using the method that preserves mitochondrial integrity. A supernatant and a pellet fraction resulting from centrifugation at 14,000 × g were obtained as described in Materials and Methods. We have used the supernatant obtained from centrifugation at 14,000 × g as the starting material in order to analyze Hsp27 interaction with cytochrome c once it is released from the mitochondria. Immunoprecipitations were carried out as described above with nonimmune (PI) or Hsp27 (Imm) antibody, and the immunoprecipitated proteins were analyzed in immunoblots probed with anti-cytochrome c antibody. Note the coimmunoprecipitation of cytochrome c released from mitochondria with Hsp27. (D) In this case, the supernatants obtained following the immunoprecipitation step performed in panel C were analyzed in immunoblot probed with both Hsp27 and cytochrome c antisera. Once again no detectable decrease in the level of cytochrome c is observed after an almost complete immunodepletion of Hsp27. (E) Same as panel D, except that HeLa cells were either nontreated (NT) or treated for 2 or 4 h with 0.125 μM staurosporine. Autoradiographs of immunoblots are presented. This experiment indicates that only a minor fraction of total mitochondria or mitochondria released cytochrome c can interact with Hsp27.
FIG. 9.
FIG. 9.
Analysis of Bid present in the cytosol of HeLa-neo15 and HeLa-ASHsp27-1 cells kept either untreated (NT) or exposed to 0.125 μM staurosporine for 1 h (1 h ST) or 3 h (3 h ST). Cells were lysed under conditions which preserve mitochondrial and membrane integrity, and the cytosolic supernatant resulting from centifugation at 20,000 × g was analyzed (as described in Materials and Methods). Total cytosolic extracts were analyzed in immunoblots probed with anti-Bid or anti-Hsc70/Hsp70 antibody. Control experiments showed that the supernatants were devoid of Cox immunoreactivity (not shown). Autoradiographs of ECL-revealed immunoblots are presented.
FIG. 10.
FIG. 10.
Hsp27 expression interferes with the staurosporine- and etoposide-induced Bid intracellular relocalization in murine L929 cells. Control L929-C2 and Hsp27-expressing L929-Hsp27 cells kept either untreated (NT) or exposed to staurosporine (1 μM) or etoposide (500 μM) for either 1, 2, or 4 h were lysed under conditions which preserve mitochondrial and membrane integrity as described in Materials and Methods. The resulting P20 and S cytosolic fractions were analyzed in immunoblots probed with anti-Bid antibody. Autoradiographs of immunoblots are shown.
FIG. 11.
FIG. 11.
Hsp27 expression interferes with cytochalasin D-induced release of cytochrome c and procaspase 3 activation. (A) Cytochrome c release analysis. Control (L929-C2) and human Hsp27-expressing (L929-Hsp27) cells were either kept untreated or treated for various times with 0.5 μM cytochalasin D. Cells were then processed, and proteins were analyzed in immunoblots as described in Materials and Methods and in the legends to Fig. 2 and 3. The presence of cytochrome c (Cytc) and Hsc70 in the different fractions is shown. Autoradiographs of ECL-revealed immunoblots are presented. Note that human Hsp27 strongly decreases the release of cytochrome c induced by cytochalasin D. Lanes: P, pellet from untreated cells; 0, 3, 6, and 9, soluble fractions isolated from untreated cells or cells treated for the indicated hours with cytochalasin D. (B) Caspase 3 activation by cytochalasin D. Control (L929-C2) and human Hsp27-expressing (L929-Hsp27) cells were treated as described above for panel A. Activity of DEVD-specific caspases was then measured using the fluorescent substrate DEVD-AFC as described in Materials and Methods. (C) Caspase 8 activation by 0.5 μM cytochalasin D. IETD-AFC activity was determined as described in Materials and Methods. The activation index was determined as the ratio between the activity in extracts of treated cells to that measured in extracts of nontreated cells. The histograms shown in panels B and C are representative of three identical experiments; standard deviations (error bars) are presented (n = 3). (D) Analysis of Bid localization in control L929-C2 and Hsp27-expressing L929-Hsp27 cells kept either untreated (NT) or exposed to 0.5 μM cytochalasin D for 1 h (1 h Cyto) or 2 h (2 h Cyto). Cells were lysed under conditions which preserve mitochondrial and membrane integrity and the resulting P2, P20, and S cytosolic supernatants were analyzed (as described in Materials and Methods). Autoradiographs of immunoblots probed with anti-Bid antibody are shown.
FIG. 12.
FIG. 12.
Phalloidin counteracts the cytochalasin D-mediated release of cytochrome c from mitochondria and procaspase 3 activation. The effect is partial in case of staurosporine-treated cells. (A) Cytochrome c release analysis. Control (L929-C2) cells were either kept untreated or treated for 6 h with 0.5 μM cytochalasin D in the absence (−) or presence (+) of 2 μM phalloidin added to the culture medium 1 h before cytochalasin D. Cells were then processed for cytochrome c release analysis and proteins present in the different fractions were analyzed in immunoblots as described in Materials and Methods. The presence of cytochrome c (Cytc) and Hsc70 in the different fractions is shown. Autoradiographs of ECL-revealed immunoblots are presented. Note that phalloidin strongly decreases the release of cytochrome c induced by cytochalasin D. Lanes, P, pellet from untreated cells; lanes 0 and 6, soluble fractions isolated from untreated cells (0) or cells treated for 6 h with cytochalasin D. (B) Same as panel A, but in this case cells were treated with 1 μM staurosporine. (C) Caspase 3 activation in L929-C2 extracts isolated after 6 h of treatment with 0.5 μM cytochalasin D in the absence or presence of 2 μM phalloidin added to the culture medium 1 h before cytochalasin D. Activity of DEVD-specific caspases was then measured using the fluorescent substrate DEVD-AFC as described in Materials and Methods. (D) Same as panel C but in the presence of 1 μM staurosporine. (E) Same as panel C but in the presence of 500 μM etoposide. The activation index was determined as the ratio between the activity in extracts of treated cells to that measured in extracts of nontreated cells. The histogram shown is representative of three identical experiments; standard deviations (error bars) are presented (n = 3). Note the protective activity of phalloidin.
FIG. 13.
FIG. 13.
Hsp27 expression interferes with cytochalasin D- and staurosporine-induced damages to F-actin. Fluorescence photomicrographs demonstrating the effect of cytochalasin D and staurosporine on F-actin fibers. Control L929-C2 cells (A to D) and human Hsp27-expressing L929-Hsp27 cells (E to H) were plated on glass plates and allowed to enter exponential cell growth phase for 24 h. They were then either kept untreated (A and E) or treated with 0.5 μM cytochalasin D (B and F), 1 μM staurosporine (C and G), or 500 μM etoposide (D and H). After 2 h of treatment the cells were fixed, stained with FITC-labeled phalloidin, and examined under a fluorescence microscope. The photomicrograph in panel G is enlarged in order to better detect the F-actin fibers (arrows), which are still visible in L929-Hsp27 cells treated with staurosporine. Bar, 10 μM.
FIG. 14.
FIG. 14.
Scheme of Hsp27-induced effects on apoptosis. Hsp27 reduces F-actin damage induced by apoptotic drugs (e.g., cytochalasin D and staurosporine) and thus attenuates the activation of the pathway that links F-actin damages to mitochondria. Activation of this pathway induces cytochrome c release, apoptosome formation, and procaspase activation. The mechanism of activation of this pathway is unknown but may be a consequence of altered integrin signaling pathway or changes in F-actin-dependent subcellular distribution of members of the Bcl-2 family such as Bid. Hsp27 also attenuates cytochrome c release in cells exposed to agents that do not rapidly destroy F-actin architecture (e.g., etoposide and Fas), suggesting that other upstream pathways are under the control of Hsp27 expression. Hsp27 also acts downstream of mitochondria by interfering with apoptosome formation, probably through its binding to cytochrome c once it is released from mitochondria. Hsp27 also appears to bind and negatively modulate caspase 3. In L929 cells, the upstream activity necessitates a higher level of Hsp27 expression (>0.45 ng/μg) compared to the downstream effect which is already detected in cells expressing Hsp27 (0.1 ng/μg).

Similar articles

Cited by

References

    1. Arrigo, A.-P., and J. Landry. 1994. Expression and function of the low-molecular-weight heat shock proteins, p.335–373. In R. I. Morimoto, A. Tissieres, and C. Georgopoulos (ed.), The biology of heat shock proteins and molecular chaperones. Cold Spring Harbor Laboratory Press, Cold Spring Harbor, N.Y.
    1. Arrigo, A. P. 1998. Small stress proteins: chaperones that act as regulators of intracellular redox state and programmed cell death. Biol. Chem. 379:19–26. - PubMed
    1. Beere, H. M., B. B. Wolf, K. Cain, D. D. Mosser, A. Mahboubi, T. Kuwana, P. Tailor, R. I. Morimoto, G. M. Cohen, and D. R. Green. 2000. Heat-shock protein 70 inhibits apoptosis by preventing recruitment of procaspase-9 to the apaf-1 apoptosome. Nat. Cell Biol. 2:469–475. - PubMed
    1. Benndorf, R., K. Hayess, S. Ryazantsev, M. Wieske, J. Behlke, and G. Lutsch. 1994. Phosphorylation and supramolecular organization of murine small heat shock protein HSP25 abolish its actin polymerization-inhibiting activity. J. Biol. Chem. 269:20780–20784. - PubMed
    1. Beresford, P. J., M. Jaju, R. S. Friedman, M. J. Yoon, and J. Lieberman. 1998. A role for heat shock protein 27 in CTL-mediated cell death. J. Immunol. 161:161–167. - PubMed

Publication types

MeSH terms