. 2002 Feb;22(3):856-65.
doi: 10.1128/MCB.22.3.856-865.2002.

Retinoblastoma protein transcriptional repression through histone deacetylation of a single nucleosome

Affiliations

Retinoblastoma protein transcriptional repression through histone deacetylation of a single nucleosome

Ashby J Morrison et al. Mol Cell Biol. 2002 Feb.

Abstract

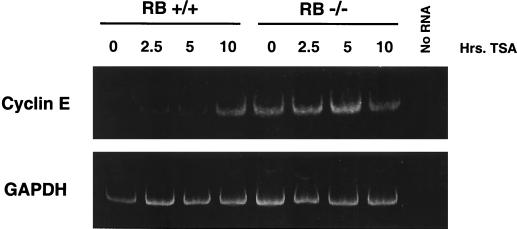
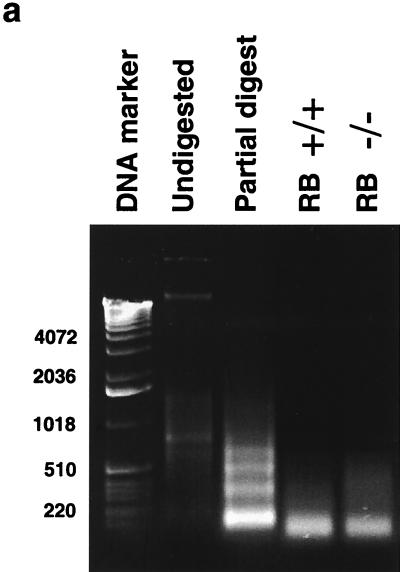
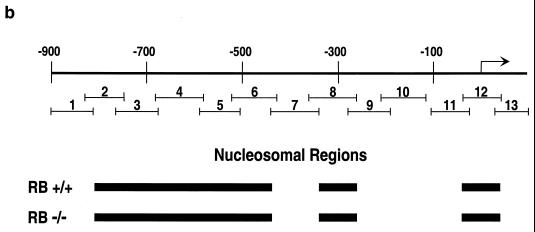
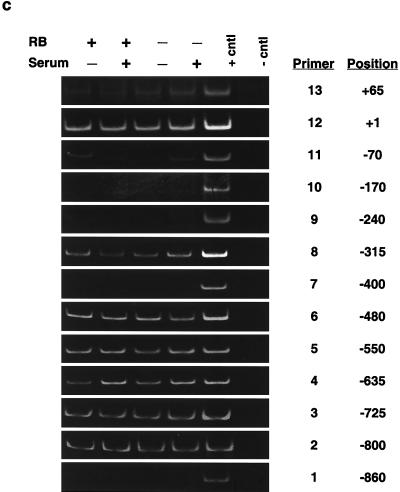
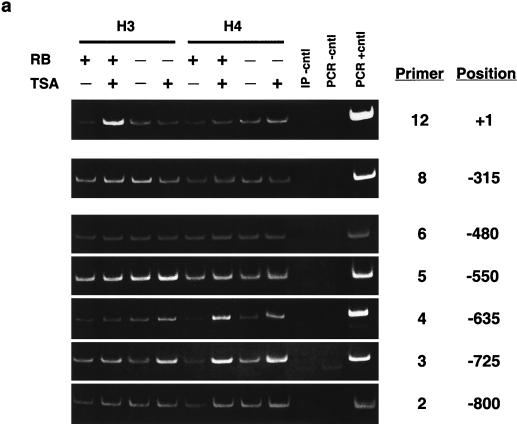
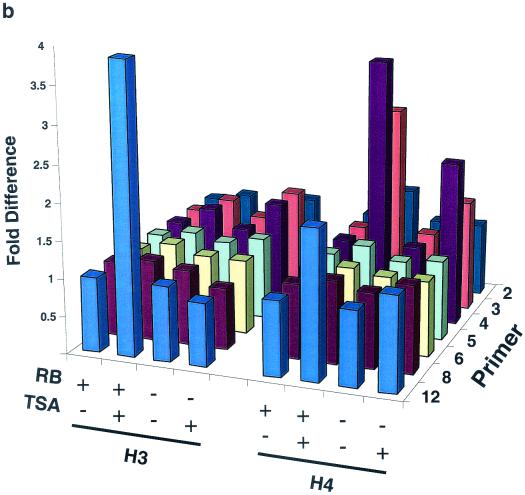
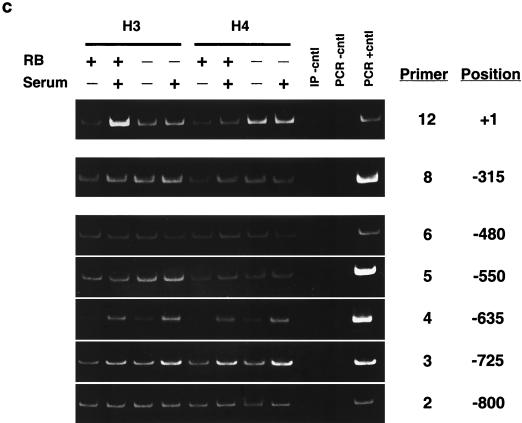
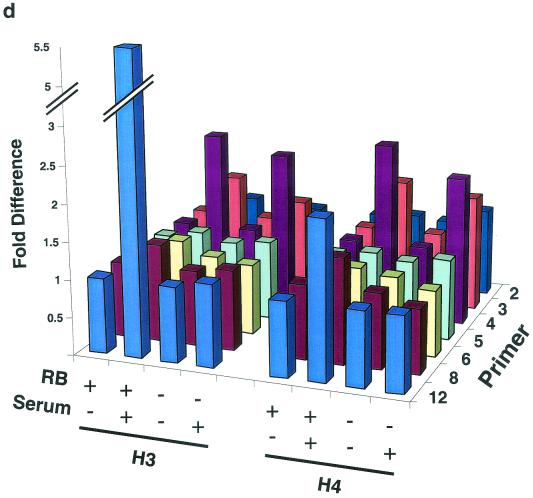
The retinoblastoma protein, pRb, controls transcription through recruitment of histone deacetylase to particular E2F-responsive genes. We determined the acetylation level of individual nucleosomes present in the cyclin E promoter of RB(+/+) and RB(-/-) mouse embryo fibroblasts. We also determined the effects of pRb on nucleosomal conformation by examining the thiol reactivity of histone H3 of individual nucleosomes. We found that pRb represses the cyclin E promoter through histone deacetylation of a single nucleosome, to which it and histone deacetylase 1 bind. In addition, the conformation of this nucleosome is modulated by pRb-directed histone deacetylase activity. Thus, the repressive role of pRb in cyclin E transcription and therefore cell cycle progression can be mapped to its control of the acetylation status and conformation of a single nucleosome.


Figures

FIG. 1.
FIG. 1.
Effects of the deacetylase inhibitor TSA on cyclin E mRNA levels in RB+/+ and RB−/− MEFs. TSA was added to G0-arrested cells for the indicated times before lysis and RNA purification. RT-PCR was performed in order to visualize the small amounts of cyclin E mRNA present in arrested RB+/+ cells. The primers used were from either cyclin E or glyceraldehyde-3-phosphate dehydrogenase (GAPDH) cDNA sequences.
FIG. 2.
FIG. 2.
Determination of nucleosome positioning on the mouse cyclin E promoter in RB+/+ and RB−/− MEFs. (a) Micrococcal nuclease digestion of RB+/+ and RB−/− MEF nuclei to produce mononucleosomal DNA. Samples were from formaldehyde-cross-linked chromatin that either was not digested with micrococcal nuclease (undigested) or was subjected to micrococcal nuclease digestion to produce partially digested chromatin (partial digest) or predominantly mononucleosome-size chromatin (RB+/+ and RB−/−). Marker sizes are in base pairs. (b) Illustration of the cyclin E promoter. The amplified region of each PCR product is shown with its corresponding number (see the text). The resulting nucleosomal regions are diagrammed as solid black bars. (c) Results of PCR analyses, with the region of the cyclin E promoter and the number corresponding to the amplified PCR product listed. RB+/+ and RB−/− MEFs were arrested in G0 (−serum) or induced to late G1 (+serum). cntl, control.
FIG. 2.
FIG. 2.
Determination of nucleosome positioning on the mouse cyclin E promoter in RB+/+ and RB−/− MEFs. (a) Micrococcal nuclease digestion of RB+/+ and RB−/− MEF nuclei to produce mononucleosomal DNA. Samples were from formaldehyde-cross-linked chromatin that either was not digested with micrococcal nuclease (undigested) or was subjected to micrococcal nuclease digestion to produce partially digested chromatin (partial digest) or predominantly mononucleosome-size chromatin (RB+/+ and RB−/−). Marker sizes are in base pairs. (b) Illustration of the cyclin E promoter. The amplified region of each PCR product is shown with its corresponding number (see the text). The resulting nucleosomal regions are diagrammed as solid black bars. (c) Results of PCR analyses, with the region of the cyclin E promoter and the number corresponding to the amplified PCR product listed. RB+/+ and RB−/− MEFs were arrested in G0 (−serum) or induced to late G1 (+serum). cntl, control.
FIG. 3.
FIG. 3.
ChIP analysis of histone H3 and histone H4 acetylation on the mouse cyclin E promoter in micrococcal nuclease-digested RB+/+ and RB−/− MEF lysates. (a) Cells were arrested in G0 and treated with either TSA or vehicle alone. The position of the nucleosomal region of the cyclin E promoter is shown, as is the designated primer set number for that region. Cntl, control; IP, immunoprecipitation. (b) Graphic representation of the results shown in panel a. This graph was obtained by performing density scans of PCR results using NIH Image 1.62 software. Data are presented as the fold difference, obtained by setting the value for the untreated (−TSA) samples within each cell line to 1. (c) Cells were arrested in G0 (−serum) or induced to late G1 (+serum). The position of the nucleosomal region of the cyclin E promoter is shown, as is the designated primer set number for that region. (d) Graphic representation of the results shown in panel c.
FIG. 3.
FIG. 3.
ChIP analysis of histone H3 and histone H4 acetylation on the mouse cyclin E promoter in micrococcal nuclease-digested RB+/+ and RB−/− MEF lysates. (a) Cells were arrested in G0 and treated with either TSA or vehicle alone. The position of the nucleosomal region of the cyclin E promoter is shown, as is the designated primer set number for that region. Cntl, control; IP, immunoprecipitation. (b) Graphic representation of the results shown in panel a. This graph was obtained by performing density scans of PCR results using NIH Image 1.62 software. Data are presented as the fold difference, obtained by setting the value for the untreated (−TSA) samples within each cell line to 1. (c) Cells were arrested in G0 (−serum) or induced to late G1 (+serum). The position of the nucleosomal region of the cyclin E promoter is shown, as is the designated primer set number for that region. (d) Graphic representation of the results shown in panel c.
FIG. 4.
FIG. 4.
ChIP analysis of histone H3 and histone H4 acetylation on the mouse cyclin E promoter and gene in RB+/+ and RB−/− MEFs. Cells were arrested in G0 (−serum) or induced to late G1 (+serum) prior to harvest. (a) PCR results labeled +1 were obtained by using cell lysates digested with micrococcal nuclease to produce DNA fragments approximately 150 bp long, and immunoprecipitated DNA was amplified by using primer set 12 (+46 to −47) of the cyclin E promoter. PCR results labeled Transcribed region were obtained by using cell lysates sonicated to produce DNA fragments of approximately 500 to 1,500 bp, and the immunoprecipitated DNA was amplified by using a primer set in the coding region of the cyclin E gene (+223 to +316). Cntl, control; IP, immunoprecipitation. (b) Graphic representation of the results shown in panel a. See the legend to Fig. 3 for details.
FIG. 4.
FIG. 4.
ChIP analysis of histone H3 and histone H4 acetylation on the mouse cyclin E promoter and gene in RB+/+ and RB−/− MEFs. Cells were arrested in G0 (−serum) or induced to late G1 (+serum) prior to harvest. (a) PCR results labeled +1 were obtained by using cell lysates digested with micrococcal nuclease to produce DNA fragments approximately 150 bp long, and immunoprecipitated DNA was amplified by using primer set 12 (+46 to −47) of the cyclin E promoter. PCR results labeled Transcribed region were obtained by using cell lysates sonicated to produce DNA fragments of approximately 500 to 1,500 bp, and the immunoprecipitated DNA was amplified by using a primer set in the coding region of the cyclin E gene (+223 to +316). Cntl, control; IP, immunoprecipitation. (b) Graphic representation of the results shown in panel a. See the legend to Fig. 3 for details.
FIG. 5.
FIG. 5.
ChIP analysis of pRb and HDAC1 binding to the mouse cyclin E promoter in RB+/+ and RB−/− MEFs. Cells were arrested in G0 (−serum) or induced to late G1 (+serum) prior to harvest. Lysates were digested with micrococcal nuclease and immunoprecipitated using anti-pRb or anti-HDAC1 antibody. Primers amplified the region of the cyclin E promoter from +46 to −47 (position +1 and primer set 12). Cntl, control; IP, immunoprecipitation.
FIG. 6.
FIG. 6.
Thiol pulldown analysis of the chromatin structure on the mouse cyclin E promoter in micrococcal nuclease-digested RB+/+ and RB−/− MEF lysates. (a) Cells were arrested in G0 (−serum) and treated with either TSA or vehicle alone. The position of the nucleosomal region of the cyclin E promoter is shown, as is the designated primer set number for that region. Cntl, control. (b) Graphic representation of the results shown in panel a. See the legend to Fig. 3 for details. (c) Cells were arrested in G0 (−serum) or induced to late G1 (+serum). The position of the nucleosomal region of the cyclin E promoter is shown, as is the designated primer set number for that region. (d) Graphic representation of the results shown in panel c.
FIG. 6.
FIG. 6.
Thiol pulldown analysis of the chromatin structure on the mouse cyclin E promoter in micrococcal nuclease-digested RB+/+ and RB−/− MEF lysates. (a) Cells were arrested in G0 (−serum) and treated with either TSA or vehicle alone. The position of the nucleosomal region of the cyclin E promoter is shown, as is the designated primer set number for that region. Cntl, control. (b) Graphic representation of the results shown in panel a. See the legend to Fig. 3 for details. (c) Cells were arrested in G0 (−serum) or induced to late G1 (+serum). The position of the nucleosomal region of the cyclin E promoter is shown, as is the designated primer set number for that region. (d) Graphic representation of the results shown in panel c.

Similar articles

Cited by

References

    1. Agalioti, T., S. Lomvardas, B. Parekh, J. Yie, T. Maniatis, and D. Thanos. 2000. Ordered recruitment of chromatin modifying and general transcription factors to the IFN-beta promoter. Cell 103:667–678. - PubMed
    1. Allegra, P., R. Sterner, D. F. Clayton, and V. G. Allfrey. 1987. Affinity chromatographic purification of nucleosomes containing transcriptionally active DNA sequences. J. Mol. Biol. 196:379–388. - PubMed
    1. Boffa, L. C., J. Walker, T. A. Chen, R. Sterner, M. R. Mariani, and V. G. Allfrey. 1990. Factors affecting nucleosome structure in transcriptionally active chromatin. Histone acetylation, nascent RNA and inhibitors of RNA synthesis. Eur. J. Biochem. 194:811–823. - PubMed
    1. Boggs, B. A., B. Connors, R. E. Sobel, A. C. Chinault, and C. D. Allis. 1996. Reduced levels of histone H3 acetylation on the inactive X chromosome in human females. Chromosoma 105:303–309. - PubMed
    1. Botz, J., K. Zerfass-Thome, D. Spitkovsky, H. Delius, B. Vogt, M. Eilers, A. Hatzigeorgiou, and P. Jansen-Durr. 1996. Cell cycle regulation of the murine cyclin E gene depends on an E2F binding site in the promoter. Mol. Cell. Biol. 16:3401–3409. - PMC - PubMed

Publication types

LinkOut - more resources