. 2002 Feb;22(3):965-77.
doi: 10.1128/MCB.22.3.965-977.2002.

Molecular balance between the regulatory and catalytic subunits of phosphoinositide 3-kinase regulates cell signaling and survival

Affiliations

Molecular balance between the regulatory and catalytic subunits of phosphoinositide 3-kinase regulates cell signaling and survival

Kohjiro Ueki et al. Mol Cell Biol. 2002 Feb.

Abstract

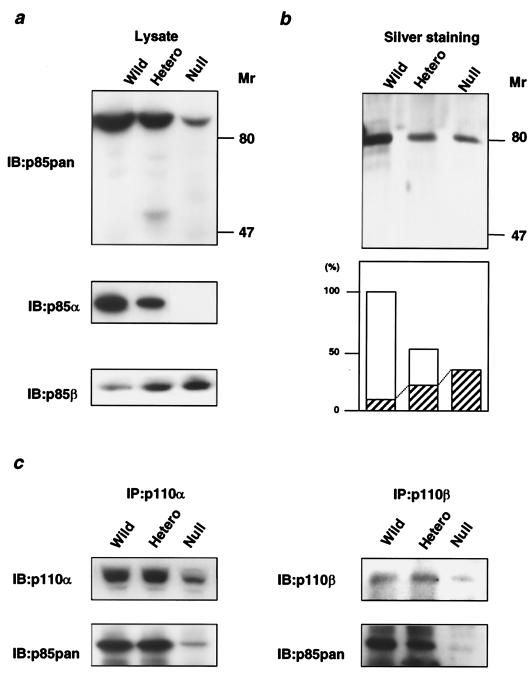
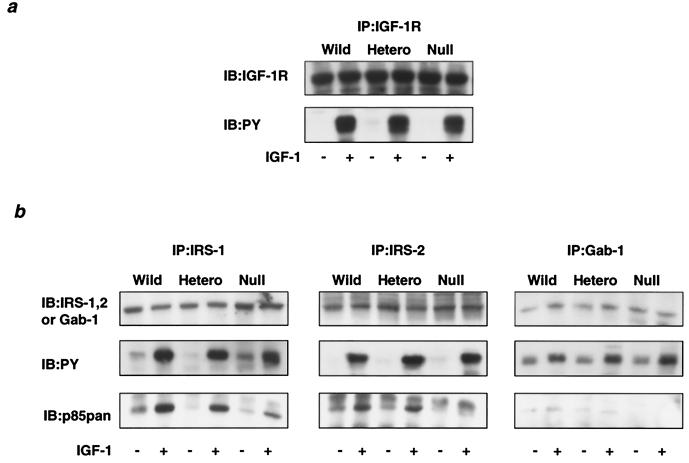
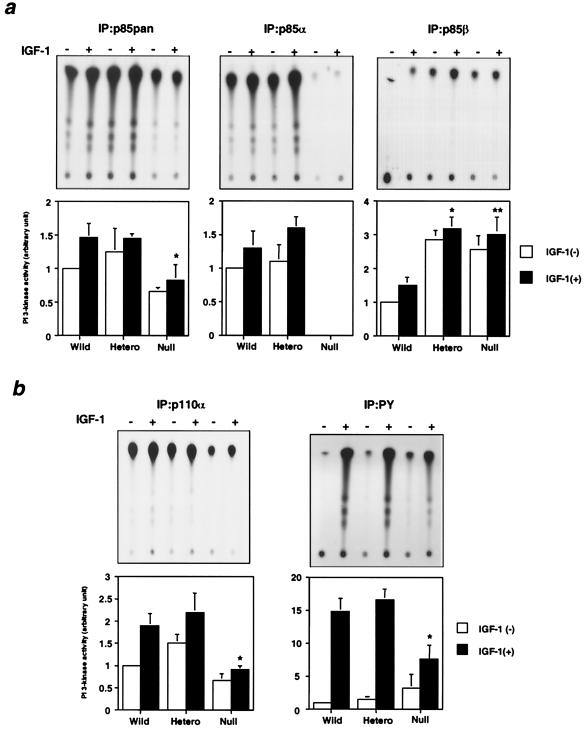
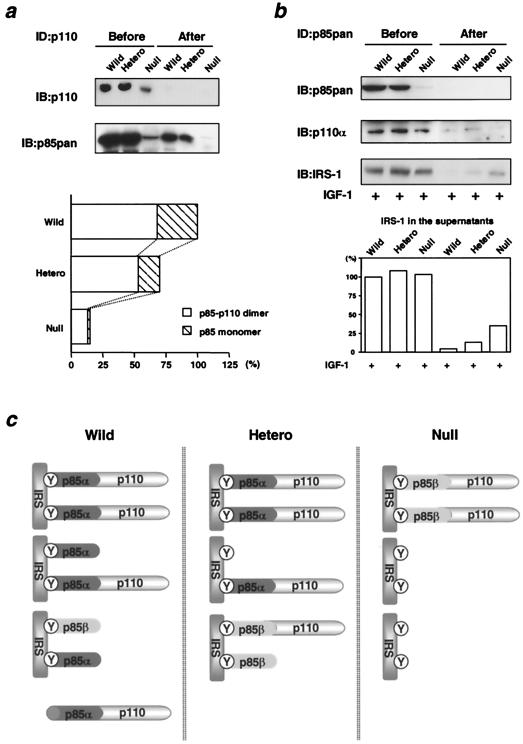
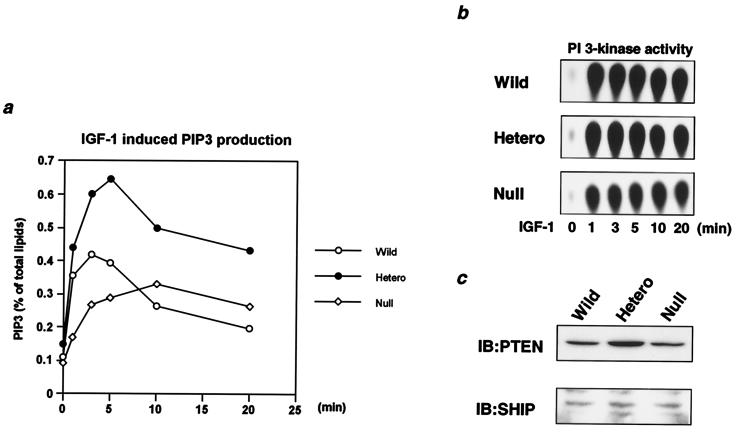
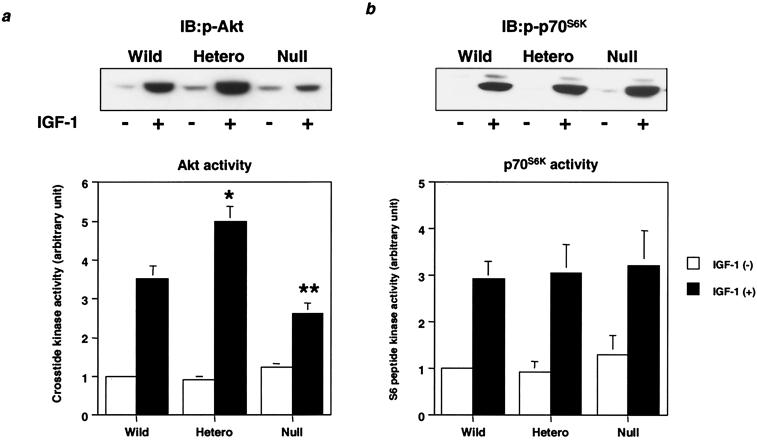
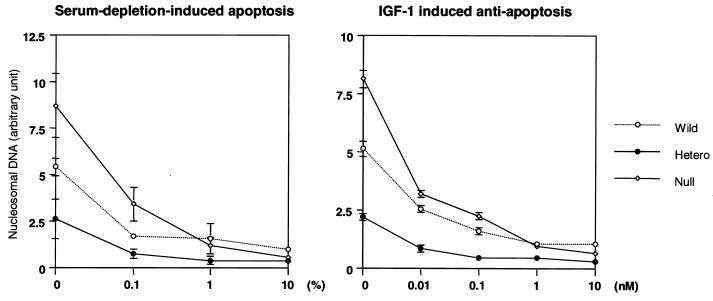
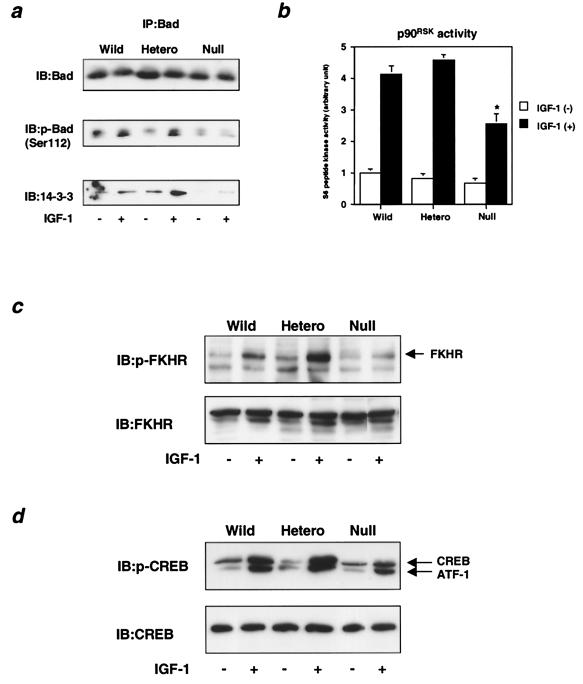
Class Ia phosphoinositide (PI) 3-kinase is a central component in growth factor signaling and is comprised of a p110 catalytic subunit and a regulatory subunit, the most common family of which is derived from the p85alpha gene (Pik3r1). Optimal signaling through the PI 3-kinase pathway depends on a critical molecular balance between the regulatory and catalytic subunits. In wild-type cells, the p85 subunit is more abundant than p110, leading to competition between the p85 monomer and the p85-p110 dimer and ineffective signaling. Heterozygous disruption of Pik3r1 results in increased Akt activity and decreased apoptosis by insulin-like growth factor 1 (IGF-1) through up-regulated phosphatidylinositol (3,4,5)-triphosphate production. Complete depletion of p85alpha, on the other hand, results in significantly increased apoptosis due to reduced PI 3-kinase-dependent signaling. Thus, a reduction in p85alpha represents a novel therapeutic target for enhancing IGF-1/insulin signaling, prolongation of cell survival, and protection against apoptosis.


Figures

FIG. 1.
FIG. 1.
Effect of disruption of Pik3r1 on class Ia PI 3-kinase complexes. (a) Expression levels of the regulatory subunits of PI 3-kinase in cells of each genotype. Cell lysates were subjected to immunoblotting with αp85pan (top panel), αp85α (middle panel), or αp85β (bottom panel). (b) Affinity purification of the regulatory subunits of PI 3-kinase from cells of each genotype using a phosphopeptide column. The cell lysates were applied to the column coupled with the phosphorylated p85-binding domain peptide of IRS-1 as described in Materials and Methods. The collected proteins were visualized by silver staining (top panel). In the bottom panel, each bar represents the mean level of eluted protein from the results of two independent experiments, and the shaded area represents the theoretical level of p85β estimated by the results shown in panel a. The value is expressed as a ratio to the total p85 protein level in wild-type cells. (c) Interaction of the regulatory subunit with p110α and p110β in cells of each genotype. The immunoprecipitates with αp110α (left panels) or anti-p110β (αp110β; right panels) antibody were subjected to immunoblotting with the same antibody (top panels) or the αp85pan antibody (bottom panels). Wild, wild type; hetero, heterozygous KO; IP, immunoprecipitate; IB, immunoblot.
FIG. 2.
FIG. 2.
Effect of disruption of Pik3r1 on the interaction between the regulatory subunit and phosphorylated IRS proteins in response to IGF-1. (a) Protein and phosphorylation levels of the IGF-1 receptor in cells of each genotype. The cells were starved for 24 h and then stimulated with 10 nM IGF-1 for 5 min. Cell lysates were subjected to immunoprecipitation with αIGF-1R followed by immunoblotting with αIGF-1R (top panel) or 4G10 (bottom panel). (b) Interaction between IRS proteins and the regulatory subunit. Cell lysates were subjected to immunoprecipitation with anti-IRS-1 (αIRS-1; left panels), anti-IRS-2 (αIRS-2; middle panels), or anti-Gab-1 (αGab-1; right panels) antibody followed by immunoblotting with the same antibody (top panels), 4G10 antibody (middle panels), or αp85pan antibody (bottom panels). Wild, wild type; hetero, heterozygous KO.
FIG. 3.
FIG. 3.
Effect of disruption of Pik3r1 on the PI 3-kinase activity associated with each signaling molecule. (a) PI 3-kinase activities associated with the regulatory subunits. The cells were starved for 24 h and then stimulated with 10 nM IGF-1 for 5 min. Cell lysates were subjected to immunoprecipitation with αp85pan (left panels), αp85α (middle panels), or αp85β (right panels) antibody followed by the PI 3-kinase assay. The top panels show representative results, and in the bottom panels each bar represents the mean ± standard deviation of the relative PI-3 kinase activity calculated from the results of three independent experiments. In the αp85pan precipitation: *, P value of <0.05 for wild-type (Wild) versus null cells. In the p85β precipitation: *, P value of <0.01 for wild versus heterozygous KO (Hetero) cells; **, P value of <0.01 for wild versus null cells. (b) PI 3-kinase activities associated with the catalytic subunit and tyrosine-phosphorylated proteins. Cell lysates were subjected to immunoprecipitation with αp110α (left panels) or 4G10 (right panels) antibody followed by the PI 3-kinase assay. Top panels show representative results, and in the bottom panels each bar represents the mean ± standard deviation of the relative PI-3 kinase activity calculated from the results of three independent experiments. *, P value of <0.01 for wild versus null cells.
FIG. 4.
FIG. 4.
Molecular balance among p85 regulatory subunits, p110 catalytic subunits, and phosphorylated IRS proteins. (a) Excess of p85 regulatory subunits in relation to p110 catalytic subunits. Cell lysates were subjected to three rounds of immunodepletion using αp110pan antibody followed by immunoblotting with αp110pan (top panel) or αp85pan (bottom panel) antibody. The amount of the p85-p110 dimer and the p85 monomer was expressed as a ratio to the amount of total p85 in the wild-type cells. In the bottom graph, each bar represents the ratio normalized to the total p85 in wild-type (Wild) cells. (b) Molecular balance between p85 regulatory subunits and phosphorylated IRS proteins. Cell lysates were subjected to three rounds of immunodepletion using αp85pan antibody followed by immunoblotting with αp85pan (top panel), αp110α (middle panel), or 4G10 (bottom panel) antibody. In the bottom graph, each bar represents phosphorylated IRS proteins detected by 4G10 in the lysates before or after immunodepletion, expressed as a ratio to the amount in wild-type cells before immunodepletion. (c) A hypothetical model of the molecular balance between p85 regulatory subunits, p110 catalytic subunits, and phosphorylated IRS proteins in cells of each genotype. Hetero, heterozygous KO; Y, phosphorylated tyrosine; ID, immunodepletion.
FIG. 5.
FIG. 5.
Effect of disruption of Pik3r1 on production of PIP3 in response to IGF-1 in vivo. (a) IGF-1-induced PIP3 production in cells of each genotype. Cells were labeled with [32P]orthophosphate as described in Materials and Methods and stimulated with 10 nM IGF-1 for the indicated period. 32P-labeled phospholipids were extracted and separated by TLC. In the graph, the mean levels of PIP3 normalized to the total labeled phospholipids from two independent experiments are shown. (b) Time course of PI 3-kinase associated with phosphotyrosine complex in cells of each genotype. Cells were stimulated with 10 nM IGF-1 for the indicated period and subjected to immunoprecipitation with 4G10 followed by the PI 3-kinase assay. (c) Expression levels of PTEN and SHIP in cells of each genotype. Cell lysates were subjected to immunoblotting with anti-PTEN (αPTEN; top panel) or anti-SHIP (αSHIP; bottom panel) antibody. Wild, wild type; Hetero, heterozygous KO.
FIG. 6.
FIG. 6.
Effect of disruption of Pik3r1 on downstream kinases from PI 3-kinase. (a) IGF-1-induced Akt activity in cells of each genotype. Cells were starved for 24 h and then stimulated with 10 nM IGF-1 for 5 min. Cell lysates were subjected to immunoblotting with anti-phospho-Akt (αphospho-Akt; top panel) antibody or immunoprecipitation with αAkt antibody. The immunoprecipitates were subjected to an immune complex kinase assay. In the bottom panel, each bar represents the mean ± standard deviation of the relative Akt kinase activity calculated from the results of three independent experiments. *, P value of <0.01 for wild-type (Wild) versus heterozygous KO (Hetero) cells; **, P value of <0.05 for wild versus null cells. (b) IGF-1-induced p70S6K activity in cells of each genotype. After 20 min of stimulation with 10 nM IGF-1, cell lysates were subjected to immunoblotting with anti-phospho-p70S6K (αphospho-p70S6K; top panel) antibody or immunoprecipitation with αp70S6K antibody. The immunoprecipitates were subjected to an immune complex kinase assay. In the bottom panel, each bar represents the mean ± standard deviation of the relative p70S6K kinase activity calculated from the results of three independent experiments.
FIG. 7.
FIG. 7.
Effect of disruption of Pik3r1 on serum deprivation-induced apoptosis and IGF-1-dependent antiapoptosis. Cells were cultured in the indicated concentration of serum (left panel) or IGF-1 without serum (right panel) for 5 h. The level of apoptosis was assessed using an enzyme-linked immunosorbent assay for nucleosomal DNA as described in Materials and Methods. Each value is expressed as the ratio of the value of the wild-type cells treated with 10% serum and represents the mean ± standard deviation of three independent experiments. Wild, wild type; Hetero, heterozygous KO.
FIG. 8.
FIG. 8.
Effect of disruption of Pik3r1 on IGF-1-dependent antiapoptotic signaling. (a) IGF-1-induced Bad phosphorylation and the interaction between Bad and 14-3-3 in cells of each genotype. Cells were starved for 24 h and then stimulated with 10 nM IGF-1 for 20 min. Cell lysates were subjected to immunoprecipitation with αBad antibody followed by immunoblotting. Immunoblots were probed with αBad (top panel), anti-phospho-Bad (αphospho-Bad; middle panel), or anti-14-3-3 (α14-3-3; bottom panel) antibody and visualized by enhanced chemiluminescence with protein A-conjugated peroxidase. (b) IGF-1-induced p90RSK activity in cells of each genotype. After 20 min of stimulation with 10 nM IGF-1, cell lysates were subjected to immunoprecipitation with αp90RSK antibody followed by an immune complex kinase assay. Each bar represents the mean ± standard deviation of the p90RSK activity calculated from the results of three independent experiments. *, P value of <0.01 for wild-type (Wild) versus null cells. (c) IGF-1-induced FKHR phosphorylation. After 20 min of stimulation with 10 nM IGF-1, cell lysates were subjected to immunoblotting with anti-phospho-FKHR (αphospho-FKHR; top panel) or anti-FKHR (αFKHR; bottom panel) antibody. (d) IGF-1-induced CREB phosphorylation in cells of each genotype. After 20 min of stimulation with 10 nM IGF-1, cell lysates were subjected to immunoblotting with anti-phospho-CREB (αphospho-CREB; top panel) or anti-CREB (αCREB; bottom panel) antibody. Hetero, heterozygous KO.

Similar articles

Cited by

References

    1. Antonetti, D. A., P. Algenstaedt, and C. R. Kahn. 1996. Insulin receptor substrate 1 binds two novel splice variants of the regulatory subunit of phosphatidylinositol 3-kinase in muscle and brain. Mol. Cell. Biol. 16:2195–2203. - PMC - PubMed
    1. Backer, J. M., M. G. Myers, Jr., S. E. Shoelson, D. J. Chin, X. J. Sun, M. Miralpeix, P. Hu, B. Margolis, E. Y. Skolnik, J. Schlessinger, and M. F. White. 1992. Phosphatidylinositol 3′-kinase is activated by association with IRS-1 during insulin stimulation. EMBO J. 11:3469–3479. - PMC - PubMed
    1. Baltensperger, K., L. M. Kozma, S. R. Jaspers, and M. P. Czech. 1994. Regulation by insulin of phosphatidylinositol 3′-kinase bound to alpha- and beta-isoforms of p85 regulatory subunit. J. Biol. Chem. 269:28937–28946. - PubMed
    1. Bonni, A., A. Brunet, A. E. West, S. R. Datta, M. A. Takasu, and M. E. Greenberg. 1999. Cell survival promoted by the Ras-MAPK signaling pathway by transcription-dependent and -independent mechanisms. Science 286:1358–1362. - PubMed
    1. Brunet, A., A. Bonni, M. J. Zigmond, M. Z. Lin, P. Juo, L. S. Hu, M. J. Anderson, K. C. Arden, J. Blenis, and M. E. Greenberg. 1999. Akt promotes cell survival by phosphorylating and inhibiting a Forkhead transcription factor. Cell 96:857–868. - PubMed

Publication types

MeSH terms