

Contribution of downstream promoter elements to transcriptional regulation of the rice tungro bacilliform virus promoter
- PMID: 11788712
- PMCID: PMC99825
- DOI: 10.1093/nar/30.2.497
Contribution of downstream promoter elements to transcriptional regulation of the rice tungro bacilliform virus promoter
Abstract
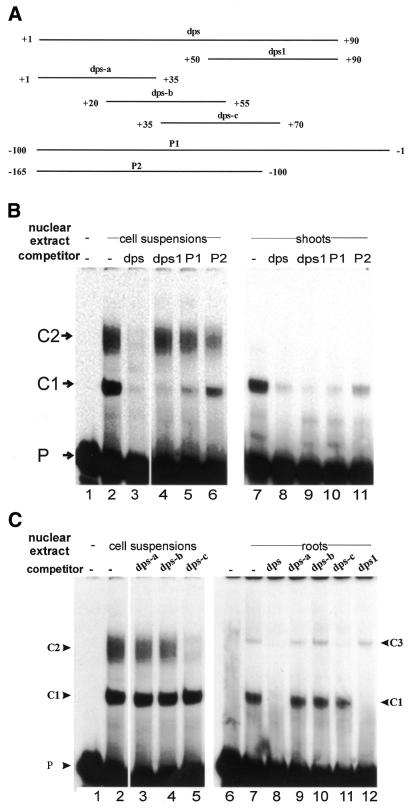
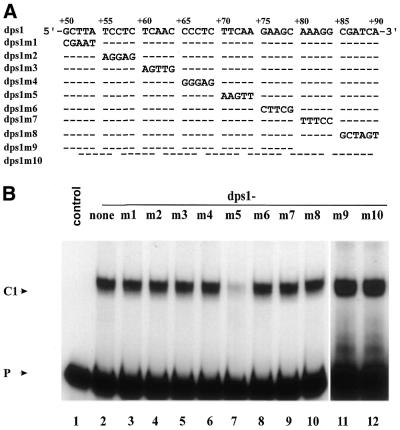
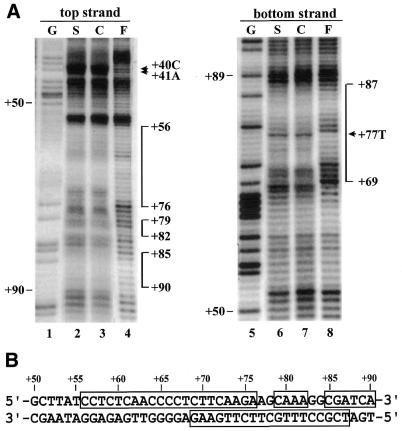
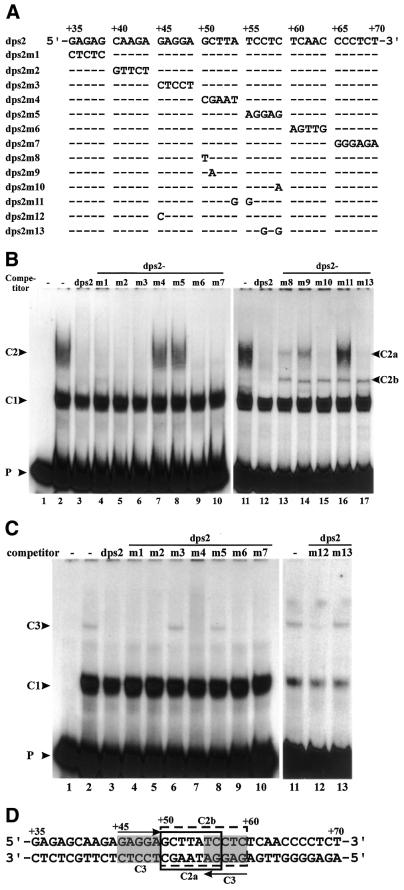
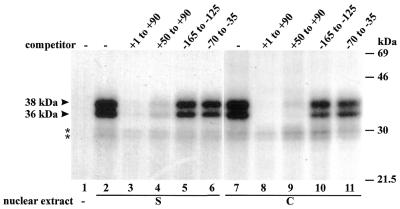
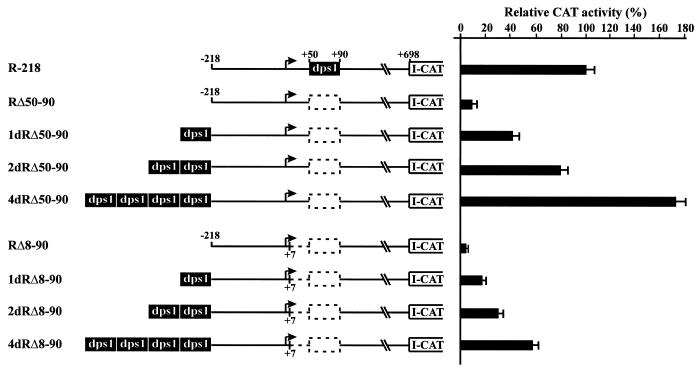
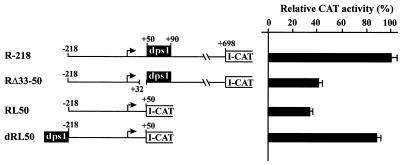
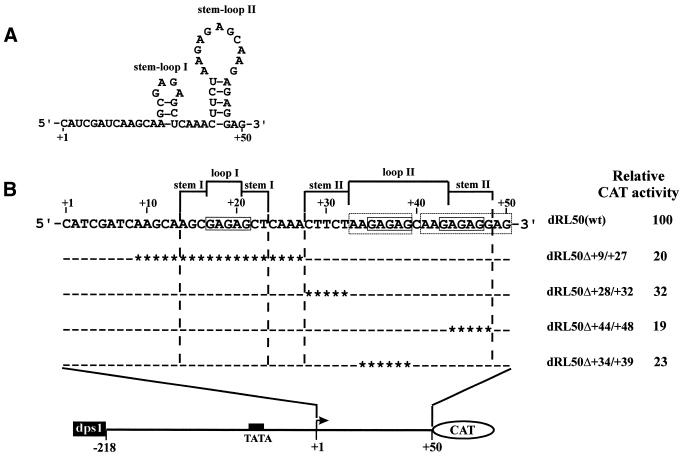
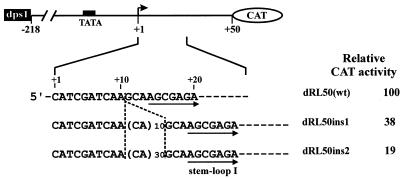
Downstream sequences influence activity of the rice tungro bacilliform virus (RTBV) promoter in protoplasts derived from cultured rice cells. We previously identified a DNA element located between positions +50 and +90 relative to the transcription start site to which rice nuclear proteins bind. In this study, using DNA UV crosslinking assays, we show that two rice nuclear proteins bind specifically to this DNA element. We demonstrate that the DNA element enhances RTBV promoter activity in a copy number-dependent manner when transferred to a position upstream of the promoter. In addition, using electrophoretic mobility shift assays, we show that at least two novel nuclear proteins from rice cell suspension cultures bind to a subregion (from +50 to +59) of the DNA element and that a protein from rice root, but not shoot, nuclear extracts interacts with a perfect palindromic sequence motif located within the sequence +45 to +59. Furthermore, a position-dependent GAGA motif, present in three copies within downstream promoter sequences from +1 to +50, is involved in the regulation of RTBV promoter activity.
Figures
Similar articles
-
Efficient transcription from the rice tungro bacilliform virus promoter requires elements downstream of the transcription start site.J Virol. 1996 Dec;70(12):8411-21. doi: 10.1128/JVI.70.12.8411-8421.1996. J Virol. 1996. PMID: 8970962 Free PMC article.
-
Transcriptional activation of the rice tungro bacilliform virus gene is critically dependent on an activator element located immediately upstream of the TATA box.J Biol Chem. 2000 Apr 21;275(16):11799-808. doi: 10.1074/jbc.275.16.11799. J Biol Chem. 2000. PMID: 10766804
-
RF2a, a bZIP transcriptional activator of the phloem-specific rice tungro bacilliform virus promoter, functions in vascular development.EMBO J. 1997 Sep 1;16(17):5247-59. doi: 10.1093/emboj/16.17.5247. EMBO J. 1997. PMID: 9311985 Free PMC article.
-
Bacilliform DNA-containing plant viruses in the tropics: commonalities within a genetically diverse group.Mol Plant Pathol. 2013 Oct;14(8):759-71. doi: 10.1111/mpp.12046. Epub 2013 Jun 13. Mol Plant Pathol. 2013. PMID: 23763585 Free PMC article. Review.
-
Identification of regulatory elements by gene family footprinting and in vivo analysis.Adv Biochem Eng Biotechnol. 2007;104:37-64. doi: 10.1007/10_027. Adv Biochem Eng Biotechnol. 2007. PMID: 17290818 Review.
Cited by
-
Analysis of the alternative oxidase promoters from soybean.Plant Physiol. 2003 Nov;133(3):1158-69. doi: 10.1104/pp.103.028183. Epub 2003 Oct 9. Plant Physiol. 2003. PMID: 14551329 Free PMC article.
-
Analysis of plant pararetrovirus promoter sequence(s) for developing a useful synthetic promoter with enhanced activity in rice, pearl millet, and tobacco plants.Front Plant Sci. 2024 Aug 6;15:1426479. doi: 10.3389/fpls.2024.1426479. eCollection 2024. Front Plant Sci. 2024. PMID: 39166238 Free PMC article.
-
Suppression of RNA silencing by a geminivirus nuclear protein, AC2, correlates with transactivation of host genes.J Virol. 2005 Feb;79(4):2517-27. doi: 10.1128/JVI.79.4.2517-2527.2005. J Virol. 2005. PMID: 15681452 Free PMC article.
-
Tissue-specific silencing of a transgene in rice.Proc Natl Acad Sci U S A. 2002 Aug 6;99(16):10881-6. doi: 10.1073/pnas.152330299. Epub 2002 Jul 19. Proc Natl Acad Sci U S A. 2002. PMID: 12134059 Free PMC article.
-
Engineered Fungus Thermothelomyces thermophilus Producing Plant Storage Proteins.J Fungi (Basel). 2022 Jan 26;8(2):119. doi: 10.3390/jof8020119. J Fungi (Basel). 2022. PMID: 35205873 Free PMC article.
References
-
- Simpson G.G. and Filipowicz,W. (1996) Splicing of precursors to mRNA in higher plants: mechanism, regulation and sub-nuclear organisation of the spliceosomal machinery. Plant Mol. Biol., 32, 1–41. - PubMed
-
- Abler M.L. and Green,P.J. (1996) Control of mRNA stability in higher plants. Plant Mol. Biol., 32, 63–78. - PubMed
-
- Gallie D.R. (1996) Translational control of cellular and viral mRNAs. Plant Mol. Biol., 32, 145–158. - PubMed
MeSH terms
Substances
LinkOut - more resources
Full Text Sources
Other Literature Sources
