. 2002 Jan 15;30(2):E7.
doi: 10.1093/nar/30.2.e7.

Quantification of 8-oxo-guanine and guanine as the nucleobase, nucleoside and deoxynucleoside forms in human urine by high-performance liquid chromatography-electrospray tandem mass spectrometry

Affiliations

Quantification of 8-oxo-guanine and guanine as the nucleobase, nucleoside and deoxynucleoside forms in human urine by high-performance liquid chromatography-electrospray tandem mass spectrometry

Allan Weimann et al. Nucleic Acids Res. .

Abstract

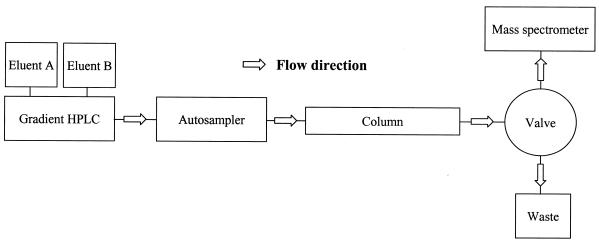
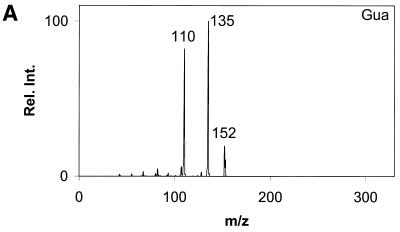
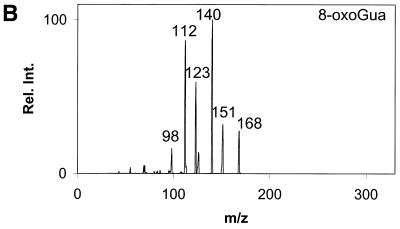
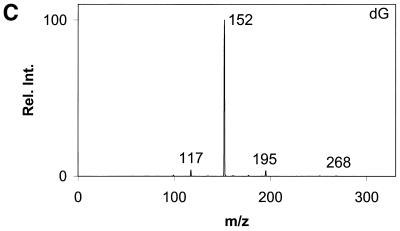
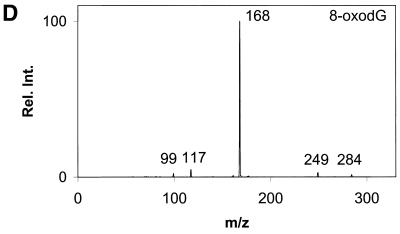
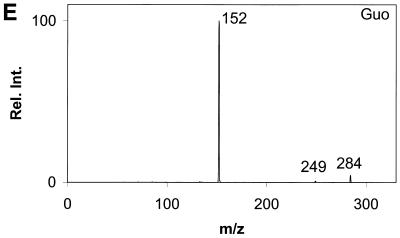
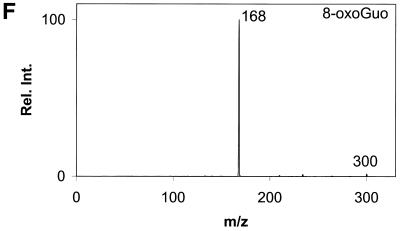
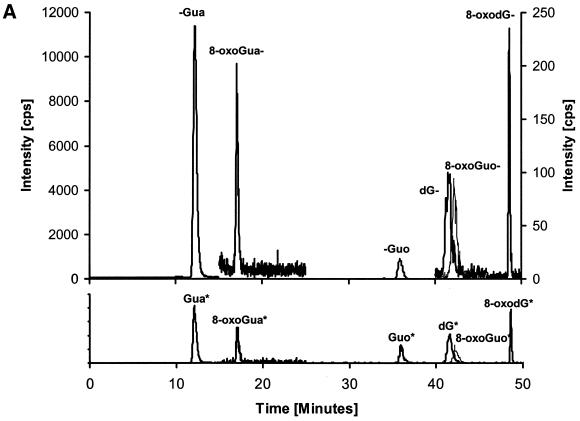
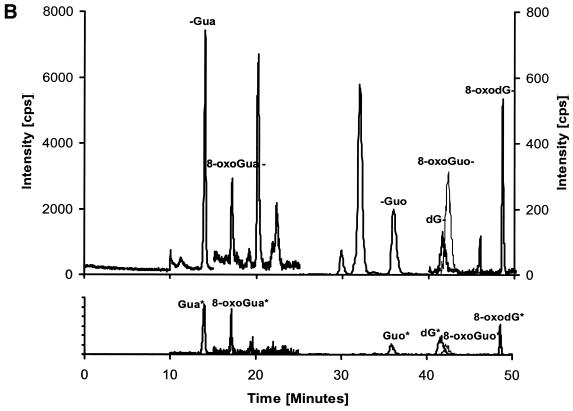
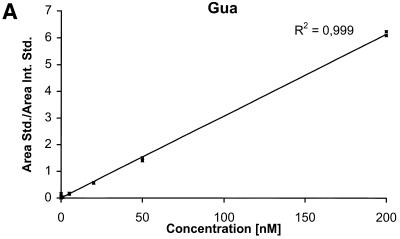
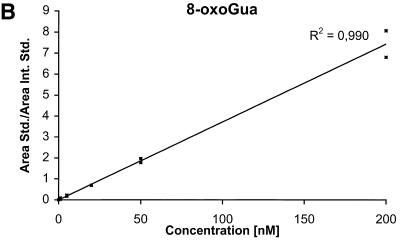
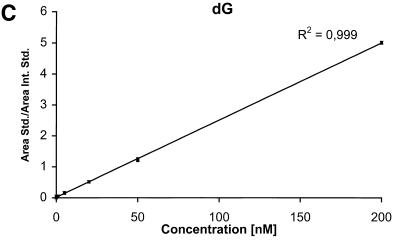
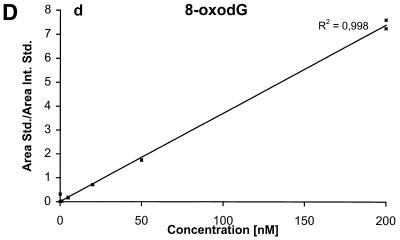
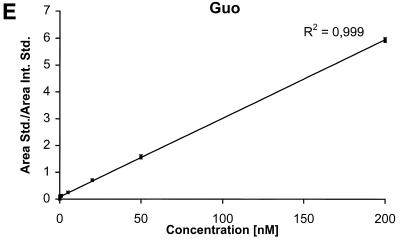
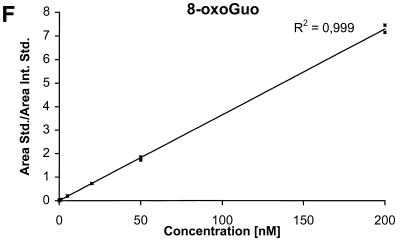
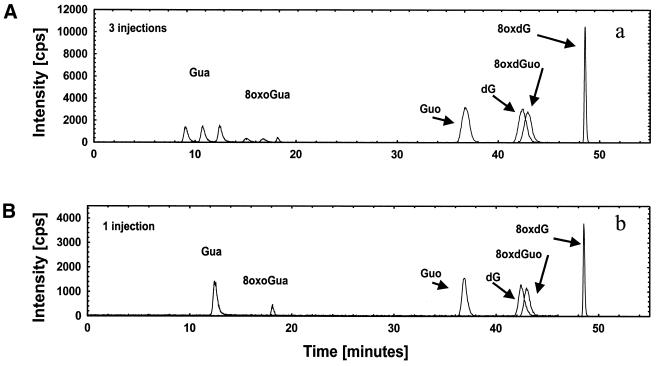
Oxidative DNA damage, linked pathogenically to a variety of diseases such as cancer and ageing, can be investigated by measuring specific DNA repair products in urine. Within the last decade, since it was established that such products were excreted into urine, progress in their analysis in urine has been limited. Guanine is the DNA base most prone to oxidation. We present a method for determination of the urinary 8-hydroxylated species of guanine, based on direct injection of urine onto a high-performance liquid chromatography (HPLC)-tandem mass spectrometry system. The analysis covers the 8-hydroxylated base, ribonucleoside and deoxynucleoside, and the corresponding non-oxidised species. Without pre-treatment of urine the detection limits for the nucleobases are approximately 2 nM (50 fmol injected) and for the nucleosides approximately 0.5 nM (12.5 fmol injected). Previously, liquid chromatography of the nucleobases has been problematic but is made possible by low-temperature reverse-phase C18 chromatography, a method that increases retention on the column. In the case of the nucleosides, retention was almost total and provides a means for on-column concentration of larger urine samples and controlled high peak gradient elution. The total excretion of 8-hydroxylated guanine species was 212 nmol/24 h. The oxidised base accounted for 64%, the ribonucleoside for 23% and the deoxynucleoside for 13%, indicating substantial oxidation of RNA in humans. In rat urine, excretion of the oxidised base was more dominant, the percentages of the oxidised base, ribonucleoside and deoxynucleosides being 89, 8 and 3%. This finding is at odds with previous reports using immunoaffinity pre-purification and HPLC-electrochemical detection analysis. The developed method now makes it possible to measure oxidative nucleic acid stress to both RNA and DNA in epidemiological and intervention settings, and our findings indicate a substantial RNA oxidation in addition to DNA oxidation. The small volume needed also makes the method applicable to small experimental animals.


Figures

Figure 1
Figure 1
HPLC–MS/MS set-up. The valve diverts only the fraction that contains the analytes into the mass spectrometer.
Figure 2
Figure 2
Daughter ion spectra of [M+H]+ of (A) Gua, (B) 8-oxoGua, (C) dG, (D) 8-oxodG, (E) Guo and (F) 8-oxoGuo. The spectra are recorded by selecting the pseudo molecular ion ([M+H]+) in the first quadrupole (Q1). After collision activation of the selected ions in the collision cell, the daughter ion spectra are recorded by scanning the last quadrupole (Q3).
Figure 2
Figure 2
Daughter ion spectra of [M+H]+ of (A) Gua, (B) 8-oxoGua, (C) dG, (D) 8-oxodG, (E) Guo and (F) 8-oxoGuo. The spectra are recorded by selecting the pseudo molecular ion ([M+H]+) in the first quadrupole (Q1). After collision activation of the selected ions in the collision cell, the daughter ion spectra are recorded by scanning the last quadrupole (Q3).
Figure 3
Figure 3
HPLC–MS/MS chromatograms. Each chromatogram is divided into four time windows. Time window 1 shows the 152/110 transitions corresponding to Gua, window 2 shows the 168/112 transitions corresponding to 8-oxoGua. Time window 3 shows the 284/152, 300/168 and 268/152 transitions corresponding to Guo, 8-oxoGuo and dG, respectively. Time window 4 shows the 284/168 transitions corresponding to 8-oxodG. (A) 10 µM standard of Gua, 8-oxoGua, dG, 8-oxodG, Guo and 8-oxoGuo. (B) Human urine sample. The peaks for 8-oxoGuo and dG are not resolved in time, but they are separated by mass.
Figure 3
Figure 3
HPLC–MS/MS chromatograms. Each chromatogram is divided into four time windows. Time window 1 shows the 152/110 transitions corresponding to Gua, window 2 shows the 168/112 transitions corresponding to 8-oxoGua. Time window 3 shows the 284/152, 300/168 and 268/152 transitions corresponding to Guo, 8-oxoGuo and dG, respectively. Time window 4 shows the 284/168 transitions corresponding to 8-oxodG. (A) 10 µM standard of Gua, 8-oxoGua, dG, 8-oxodG, Guo and 8-oxoGuo. (B) Human urine sample. The peaks for 8-oxoGuo and dG are not resolved in time, but they are separated by mass.
Figure 4
Figure 4
Calibration curves obtained by plotting the ratio between the area of the analyte peak divided by the area of the internal standard peak as a function of the analyte concentration. Calibration curve for (A) Gua, (B) 8-oxoGua, (C) dG, (D) 8-oxodG, (E) Guo and (F) 8-oxoGuo.
Figure 4
Figure 4
Calibration curves obtained by plotting the ratio between the area of the analyte peak divided by the area of the internal standard peak as a function of the analyte concentration. Calibration curve for (A) Gua, (B) 8-oxoGua, (C) dG, (D) 8-oxodG, (E) Guo and (F) 8-oxoGuo.
Figure 4
Figure 4
Calibration curves obtained by plotting the ratio between the area of the analyte peak divided by the area of the internal standard peak as a function of the analyte concentration. Calibration curve for (A) Gua, (B) 8-oxoGua, (C) dG, (D) 8-oxodG, (E) Guo and (F) 8-oxoGuo.
Figure 4
Figure 4
Calibration curves obtained by plotting the ratio between the area of the analyte peak divided by the area of the internal standard peak as a function of the analyte concentration. Calibration curve for (A) Gua, (B) 8-oxoGua, (C) dG, (D) 8-oxodG, (E) Guo and (F) 8-oxoGuo.
Figure 4
Figure 4
Calibration curves obtained by plotting the ratio between the area of the analyte peak divided by the area of the internal standard peak as a function of the analyte concentration. Calibration curve for (A) Gua, (B) 8-oxoGua, (C) dG, (D) 8-oxodG, (E) Guo and (F) 8-oxoGuo.
Figure 4
Figure 4
Calibration curves obtained by plotting the ratio between the area of the analyte peak divided by the area of the internal standard peak as a function of the analyte concentration. Calibration curve for (A) Gua, (B) 8-oxoGua, (C) dG, (D) 8-oxodG, (E) Guo and (F) 8-oxoGuo.
Figure 5
Figure 5
On-column concentration. (A) Three injections (1 min in between). (B) One injection. Three injections results in three peaks for each of the nucleobases, which shows that they cannot be concentrated on-column. The peak heights for Guo, 8-oxoGuo and dG are increased 2–2.5 times after triple injection [compare (A) and (B)]. This shows that the sensitivities for Guo, 8-oxoGuo and dG can be increased upon multiple injections, but Gua and 8-oxoGua are not fully retained on the column during injection. For 8-oxodG the peak height is approximately three times the single injection peak height, which shows that it is fully retained on the column during injection, and that it can be fully concentrated on-column.

References

    1. Chance B., Sies,H. and Boveris,A. (1979) Hydroperoxide metabolism in mammalian organs. Physiol. Rev., 59, 527–605. - PubMed
    1. Halliwell B. and Gutteridge,J.M.C. (1989) Free Radicals in Biology and Medicine. Clarendon Press, Oxford, Vol. 2, pp. 1–543.
    1. Halliwell B. (1999) Oxygen and nitrogen are pro-carcinogens. Damage to DNA by reactive oxygen, chlorine and nitrogen species: measurement, mechanism and the effects of nutrition. Mutat. Res., 443, 37–52. - PubMed
    1. Beckman K.B. and Ames,B.N. (1999) Endogenous oxidative damage of mtDNA Mutat. Res., 424, 51–58. - PubMed
    1. Zhang J., Perry,G., Smith,M.A., Robertson,D., Olson,S.J., Graham,D.G. and Montine,T.J. (1999) Parkinson’s disease is associated with oxidative damage to cytoplasmic DNA and RNA in substantia nigra neurons. Am. J. Pathol., 154, 1423–1429. - PMC - PubMed

Publication types

MeSH terms