

Sodium channel function and the excitability of human cutaneous afferents during ischaemia
- PMID: 11790811
- PMCID: PMC2290064
- DOI: 10.1113/jphysiol.2001.012478
Sodium channel function and the excitability of human cutaneous afferents during ischaemia
Abstract
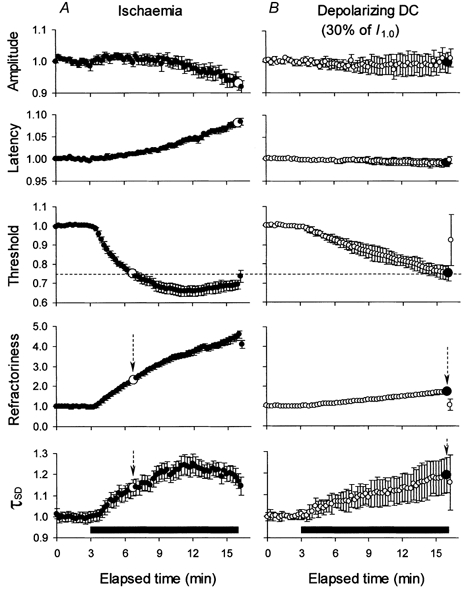
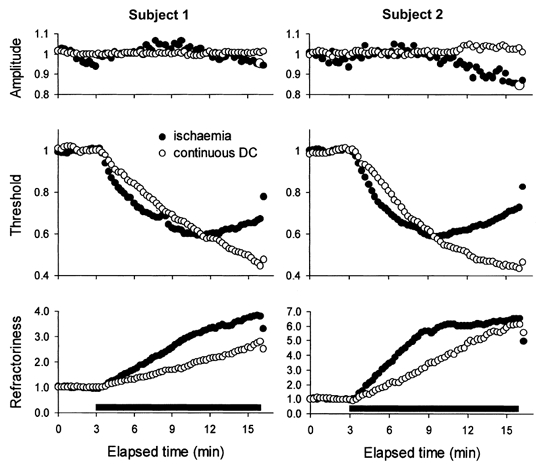
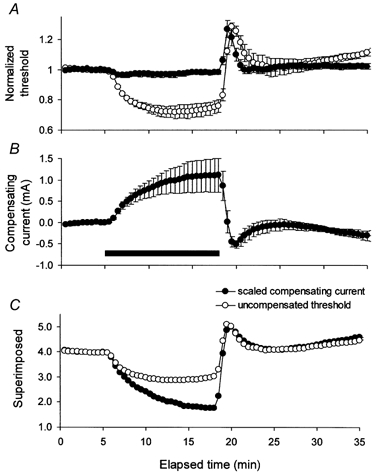
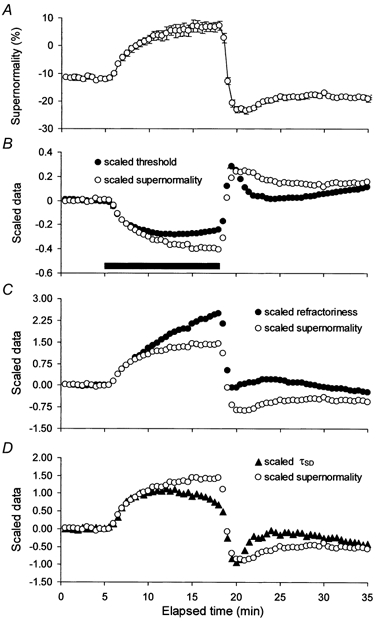
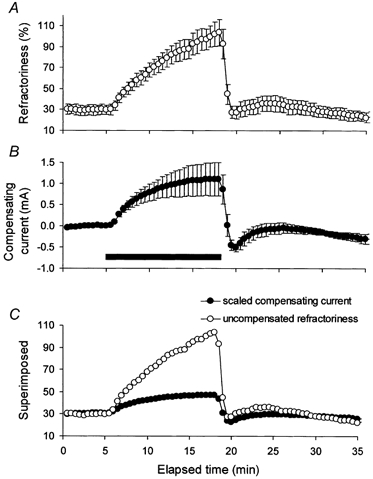
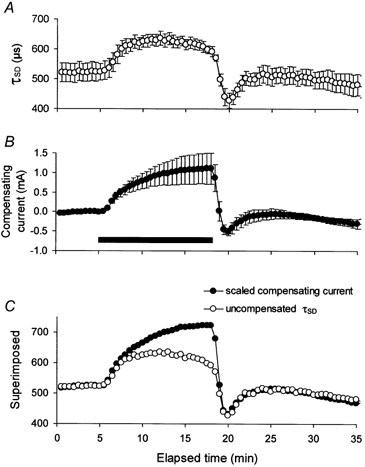
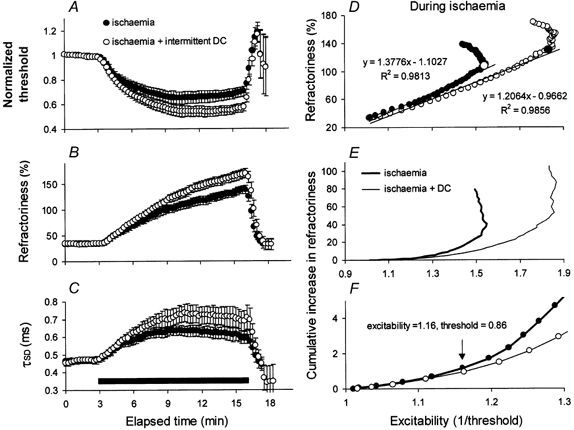
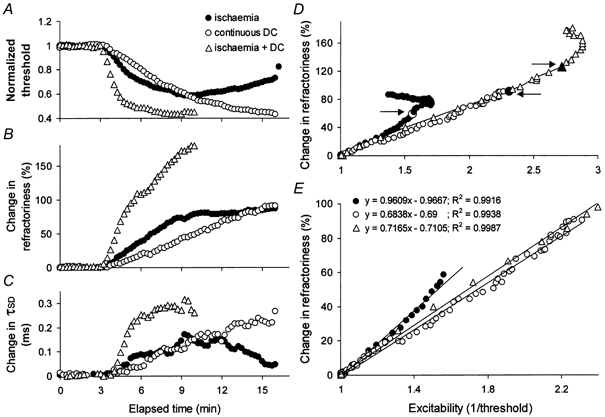
The changes in excitability of cutaneous afferents in the median nerve of healthy subjects were compared during 13 min of ischaemia and during 13 min continuous depolarizing DC. In addition, intermittent polarizing currents were used to compensate for or to accentuate the threshold change produced by ischaemia. Measurements were made alternately of the ischaemic (or current-induced) changes in threshold, refractoriness and, in some experiments, supernormality. The strength-duration time constant (tau(SD)) was calculated from the thresholds to test stimuli of different duration. During ischaemia for 13 min, the threshold decreased steadily by 34 % over the initial 8 min, reached a plateau and increased slightly over the final few minutes. However, with continuous depolarizing DC, the threshold decreased linearly with the applied current, by 55 % with strong current ramps. Intermittent injection of hyperpolarizing DC was used to compensate for the ischaemic threshold change, but the compensating current increased progressively and did not reach a plateau as had occurred with the ischaemic threshold change. During ischaemia, tau(SD) increased to a plateau, following the threshold more closely than the current required to compensate for threshold. Refractoriness, on the other hand, increased more steeply than the applied compensating current. There were similar discrepancies in the relationships of tau(SD) and refractoriness to supernormality. The smaller-than-expected threshold change during ischaemia could result from limitations on the change in excitability produced by ischaemic metabolites acting on the gating and/or permeability of Na(+) channels. Intermittent depolarizing DC was applied during the ischaemic depolarization to determine whether it would reduce or accentuate the discrepancies noted during ischaemia alone. The extent of the threshold change was greater than with ischaemia alone, and there was a greater change in tau(SD) and a proportionately smaller change in refractoriness. It is concluded that ischaemia produces factors that can block Na(+) channels and/or alter their gating. Without these processes, the ischaemic change in threshold would be much greater than that actually recorded, probably sufficient to produce prominent ectopic impulse activity.
Figures
Similar articles
-
Ischaemic changes in refractoriness of human cutaneous afferents under threshold-clamp conditions.J Physiol. 2000 Mar 15;523 Pt 3(Pt 3):807-15. doi: 10.1111/j.1469-7793.2000.t01-1-00807.x. J Physiol. 2000. PMID: 10718757 Free PMC article.
-
Changes in excitability indices of cutaneous afferents produced by ischaemia in human subjects.J Physiol. 1999 Jul 1;518(Pt 1):301-14. doi: 10.1111/j.1469-7793.1999.0301r.x. J Physiol. 1999. PMID: 10373711 Free PMC article. Clinical Trial.
-
Responses of human sensory and motor axons to the release of ischaemia and to hyperpolarizing currents.J Physiol. 2002 Jun 15;541(Pt 3):1025-39. doi: 10.1113/jphysiol.2002.017848. J Physiol. 2002. PMID: 12068060 Free PMC article. Clinical Trial.
-
Excitability changes in human sensory and motor axons during hyperventilation and ischaemia.Brain. 1997 Feb;120 ( Pt 2):317-25. doi: 10.1093/brain/120.2.317. Brain. 1997. PMID: 9117378
-
Determining Ischaemic Thresholds Through Our Understanding of Cellular Metabolism.2019 Sep 3. In: Mauffrey C, Hak DJ, Martin III MP, editors. Compartment Syndrome: A Guide to Diagnosis and Management [Internet]. Cham (CH): Springer; 2019. Chapter 4. 2019 Sep 3. In: Mauffrey C, Hak DJ, Martin III MP, editors. Compartment Syndrome: A Guide to Diagnosis and Management [Internet]. Cham (CH): Springer; 2019. Chapter 4. PMID: 32091739 Free Books & Documents. Review.
Cited by
-
Local antinociception induced by endothelin-1 in the hairy skin of the rat's back.J Pain. 2009 Jul;10(7):702-14. doi: 10.1016/j.jpain.2008.12.005. J Pain. 2009. PMID: 19559389 Free PMC article.
-
Changes in human sensory axonal excitability induced by focal nerve compression.J Physiol. 2010 May 15;588(Pt 10):1737-45. doi: 10.1113/jphysiol.2010.188169. Epub 2010 Mar 29. J Physiol. 2010. PMID: 20351048 Free PMC article.
-
Excitability of human muscle afferents studied using threshold tracking of the H reflex.J Physiol. 2002 Dec 1;545(2):661-9. doi: 10.1113/jphysiol.2002.026526. J Physiol. 2002. PMID: 12456841 Free PMC article.
-
Oxidation of multiple methionine residues impairs rapid sodium channel inactivation.Pflugers Arch. 2008 Sep;456(6):1085-95. doi: 10.1007/s00424-008-0477-6. Epub 2008 Mar 28. Pflugers Arch. 2008. PMID: 18369661 Free PMC article.
-
Why are sensory axons more vulnerable for ischemia than motor axons?PLoS One. 2013 Jun 20;8(6):e67113. doi: 10.1371/journal.pone.0067113. Print 2013. PLoS One. 2013. PMID: 23840596 Free PMC article.
References
-
- Baker MD, Bostock H. Low-threshold, persistent sodium current in rat large dorsal root ganglion neurons in culture. Journal of Neurophysiology. 1997;77:1503–1513. - PubMed
-
- Baker MD, Bostock H. Inactivation of macroscopic late Na+ current and characteristics of unitary late Na+ currents in sensory neurons. Journal of Neurophysiology. 1998;80:2538–2549. - PubMed
-
- Baker MD, Bostock H. The pH dependence of late sodium current in large sensory neurons. Neuroscience. 1999;92:1119–1130. - PubMed
Publication types
MeSH terms
Substances
LinkOut - more resources
Full Text Sources