. 2002 Jan 15;538(Pt 2):447-63.
doi: 10.1113/jphysiol.2001.013051.

Analysis of whole-cell currents by patch clamp of guinea-pig myenteric neurones in intact ganglia

Affiliations

Analysis of whole-cell currents by patch clamp of guinea-pig myenteric neurones in intact ganglia

François Rugiero et al. J Physiol. .

Abstract

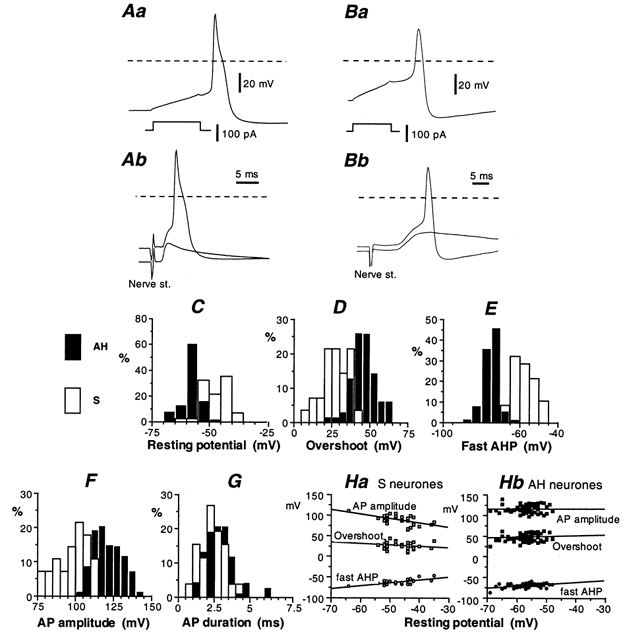
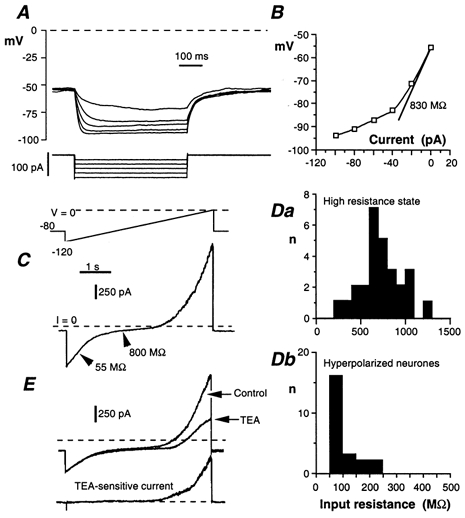
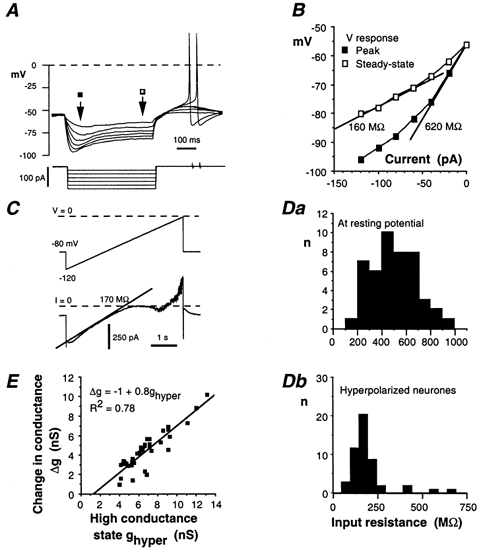
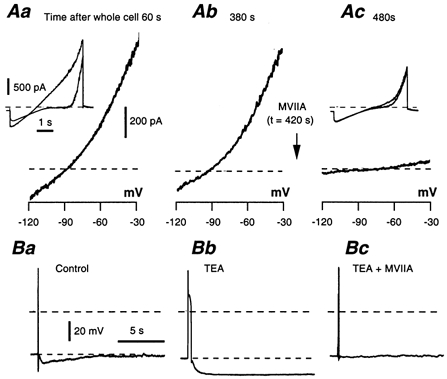
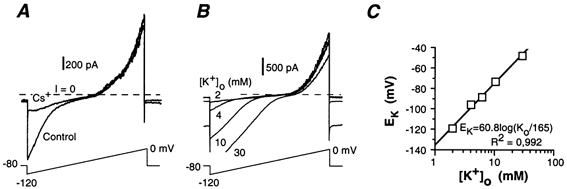
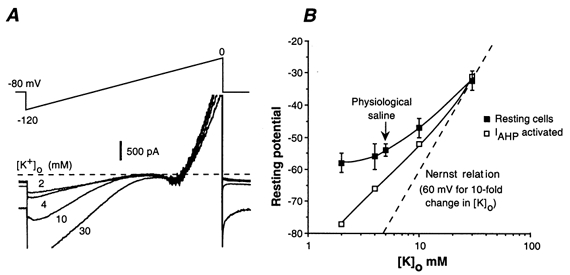
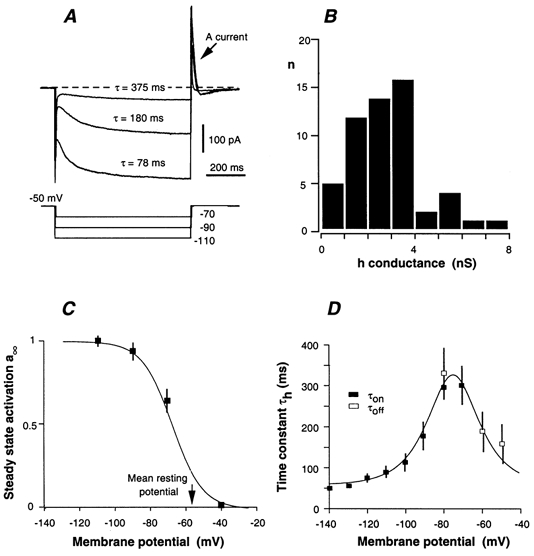
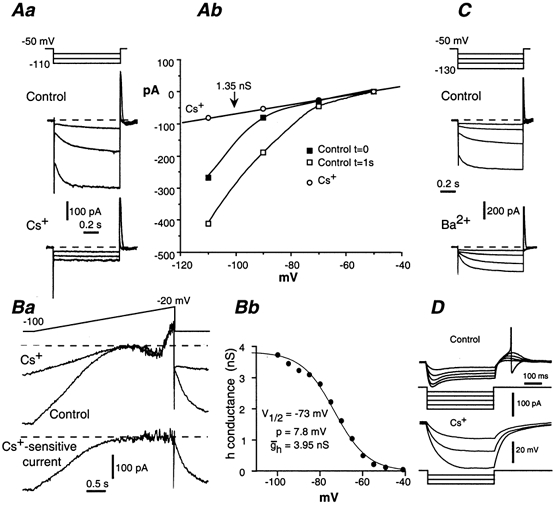
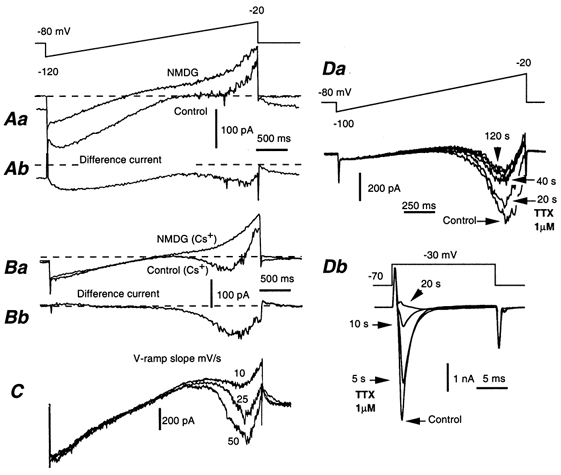
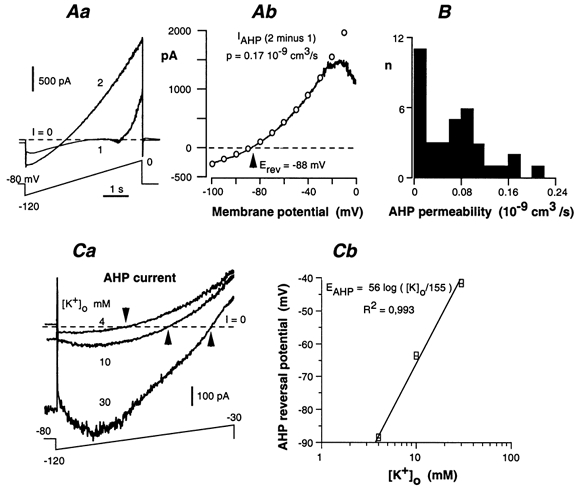
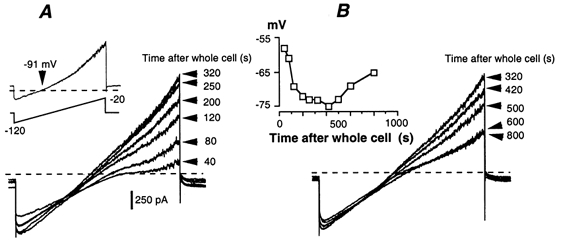
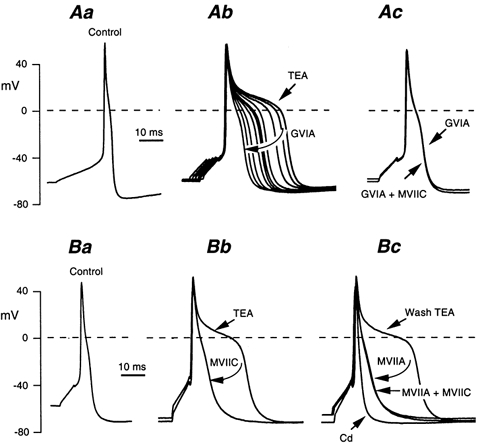
Whole-cell patch-clamp recordings taken from guinea-pig duodenal myenteric neurones within intact ganglia were used to determine the properties of S and AH neurones. Major currents that determine the states of AH neurones were identified and quantified. S neurones had resting potentials of -47 +/- 6 mV and input resistances (R(in)) of 713 +/- 49 MOmega at voltages ranging from -90 to -40 mV. At more negative levels, activation of a time-independent, caesium-sensitive, inward-rectifier current (I(Kir)) decreased R(in) to 103 +/- 10 MOmega. AH neurones had resting potentials of -57 +/- 4 mV and R(in) was 502 +/- 27 MOmega. R(in) fell to 194 +/- 16 MOmega upon hyperpolarization. This decrease was attributable mainly to the activation of a cationic h current, I(h), and to I(Kir). Resting potential and R(in) exhibited a low sensitivity to changes in [K(+)](o) in both AH and S neurones. This indicates that both cells have a low background K(+) permeability. The cationic current, I(h), contributed about 20 % to the resting conductance of AH neurones. It had a half-activation voltage of -72 +/- 2 mV, and a voltage sensitivity of 8.2 +/- 0.7 mV per e-fold change. I(h) has relatively fast, voltage-dependent kinetics, with on and off time constants in the range of 50-350 ms. AH neurones had a previously undescribed, low threshold, slowly inactivating, sodium-dependent current that was poorly sensitive to TTX. In AH neurones, the post-action-potential slow hyperpolarizing current, I(AHP), displayed large variation from cell to cell. I(AHP) appeared to be highly Ca(2+) sensitive, since its activation with either membrane depolarization or caffeine (1 mM) was not prevented by perfusing the cell with 10 mM BAPTA. We determined the identity of the Ca(2+) channels linked to I(AHP). Action potentials of AH neurones that were elongated by TEA (10 mM) were similarly shortened and I(AHP) was suppressed with each of the three omega-conotoxins GVIA, MVIIA and MVIIC (0.3-0.5 microM), but not with omega-agatoxin IVA (0.2 microM). There was no additivity between the effects of the three conotoxins, which indicates the presence of N- but not of P/Q-type Ca(2+) channels. A residual Ca(2+) current, resistant to all toxins, but blocked by 0.5 mM Cd(2+), could not generate I(AHP). This patch-clamp study, performed on intact ganglia, demonstrates that the AH neurones of the guinea-pig duodenum are under the control of four major currents, I(AHP), I(h), an N-type Ca(2+) current and a slowly inactivating Na(+) current.


Figures

Figure 1
Figure 1. Action potential characteristics of AH and S neurones
A and B, action potentials triggered by stimulating an AH neurone (Aa) and an S neurone (Ba) with an intracellular current pulse (lower trace in Aa and Ba) or applying an electrical shock (nerve stimulation, 0.1 ms, 10–20 V) to one of the nerves connected to the ganglion (Ab and Bb). In Ab, the action potential of the AH neurone was antidromically evoked. A non-invading electrotonic potential (‘A spike’; lower trace in Ab) was revealed by hyperpolarizing the cell. The nerve stimulation in Bb evoked a fast EPSP (lower trace) that was large enough to trigger an overshooting action potential in an S neurone. Hyperpolarization revealed the synaptic potential without the superimposed action potential (lower trace). Dashed lines show the 0 mV level. C, distribution of the resting potential of AH (filled columns) and S neurones (open columns). The resting potential was measured within 30 s after patch rupture and is not corrected for electrode tip potential. This histogram was derived from the results of 71 AH neurones and 38 S neurones. D-G, distribution of the action potential characteristics of AH neurones (filled columns) and S neurones (open columns). Same population as in C. The peak-to-peak action potential amplitude (F) was measured from the overshoot (D) to the after-hyperpolarization (AHP) immediately following the action potential repolarization (E). The action potential duration (G) was measured at half amplitude (∼ −20 mV). Ha and Hb, dependence of the action potential characteristics of S and AH neurones on the resting potential. In C-G, results are expressed as the percentage (%) of the cell population by bin (5 mV in C-F, 0.5 ms in G).
Figure 2
Figure 2. Input resistance of S neurones
A, response of an S neurone to 0.5 s hyperpolarizing current pulses incremented by 20 pA. B, corresponding I-V plot measured at the end of the current pulse. Input resistance (Rin) at rest is given by the slope of the straight line. Reduced Rin at hyperpolarized potentials is due to the presence of an inward rectifier. C, S neurone subjected to a slowly rising (24 mV s−1) voltage ramp (voltage-clamp conditions) from −120 to 0 mV. S neurones had a high Rin between −90 and −40 mV. The impedance was considerably reduced by the activation of an inwardly rectifying K+ current at V < −90 mV and by a delayed rectifier at V > −40 mV. D, distribution of Rin of S neurones in the high-resistance state (Da) and upon activation of the inwardly rectifying current (Db). E, effect of TEA (10 mm) on the I-V curve. Same voltage programme as in C. Lower trace, difference current revealing the delayed rectifier.
Figure 4
Figure 4. Rin of AH neurones
A, response of an AH neurone to 0.5 s hyperpolarizing current pulses incremented by 20 pA. B, I-V plot for the cell illustrated in A. Filled squares: relationship prior to Ih activation; open squares: relationship in presence of Ih. Slope resistances are measured from the straight lines shown on the figure. C, same neurone subjected to a slowly (24 mV s−1) rising voltage-ramp (voltage-clamp conditions) from −120 to 0 mV. The slope of the current trace at voltages positive to −90 mV corresponded to a Rin of 170 MΩ. D, distribution of the Rin in AH neurones. Da, neurones at the resting potential; Rin determined as shown in B (filled squares). Db, Rin upon activation of the h current (open squares in B). E, relationship between the high conductance state ghyper (nS) in hyperpolarized neurones (data are from Db) and the increase in conductance (Δg) that occurred when AH neurones were hyperpolarized from the resting level.
Figure 12
Figure 12. Block of the slow IAHP with Ω-CgTX MVIIA
A, IAHP recorded as a difference current in an AH neurone 60 s (Aa) and 380 s (Ab) after breaking the membrane patch. Inset in Aa: two-ramp method applied from −120 to 0 mV. These successive controls were performed systematically to detect a possible spontaneous decrease in IAHP. Ac, same protocol applied 60 s after adding 0.5 μm Ω-CgTX MVIIA, which abolished IAHP. B, effect of 0.5 μm Ω-CgTX MVIIA on the slow AHP following the elongation of the action potential with TEA (10 mm). The slow AHP was abolished.
Figure 3
Figure 3. Properties of the inward rectifier of S neurones
A, current response to depolarizing voltage-ramps in an S neurone in physiological saline (control) and in the presence of 2 mm extracellular Cs+. Cs+ abolished the increase in inward current at V < −90 mV. B, increase of the inwardly rectifying current by changing the [K+]o from 2 to 30 mm. C, plot of the threshold of the inwardly rectifying current, identified as the K+ reversal potential (EK), versus [K+]o. Data are from the experiment illustrated in B.
Figure 5
Figure 5. Sensitivity of AH neurones to changes in [K+]o
A, increase in IKir and Ih with elevated [K+]o (same conditions as in Fig. 3B). B, effects of changes in [K+]o on the membrane potential of AH neurones at rest (filled squares, n = 7) and when IAHP is activated (open squares) compared to the theoritical changes for a K+ conductance according to the Nernst relationship (dotted line). Open squares, example of the AHP sensitivity to changes in [K+]o.
Figure 6
Figure 6. Properties of the cationic h current (Ih) of AH neurones
A, current response of an AH neurone to 1 s hyperpolarizing voltage pulses applied from −50 mV. Note the transient activation of a fast A-type K+ current immediately after the pulse. B, distribution of the maximal h conductance in 58 AH neurones. The h conductance was evaluated from the amplitude of the steady-state Ih and the Ih reversal potential, Eh = −40 mV. C, steady-state activation, a, of Ih. Data are from seven AH neurones. The curve was drawn according to the equation given in the text. D, voltage dependence of the time constant, τh of Ih changes. Data are from 14 AH neurones. τh was determined by fitting the current change to exponential curves during the hyperpolarizing voltage pulse (τon) and after the current pulse (τoff). The continuous curve was drawn according to the equation given in the text.
Figure 7
Figure 7. Contribution of Ih to the input conductance of AH neurones
A and B, block of Ih with extracellularly applied Cs+ (2 mm). Aa, Ih induced by 1 s hyperpolarizing voltage pulses (incremented by 20 mV). Ab, corresponding I-V plot. In control conditions, currents were measured at the beginning (filled squares) and at the end (open squares) of the voltage pulse. Cs+ (circles) blocked both Ih and the inwardly rectifying K+ current, which is prominent at V < −90 mV. Ba, currents induced by slowly depolarizing the neurone (16 mV s−1) in control conditions and in the presence of Cs+. Lower trace, caesium-sensitive current obtained by subtracting the current trace in the presence of Cs+ to the control current. Bb, corresponding voltage dependance of the h conductance. C, insensitivity of Ih to Ba2+ (2 mm). In contrast to Cs+, Ba2+ did not affect the time-dependent Ih current, but blocked the time-independent inwardly rectifying K+ current. D, current-clamp conditions. Block of Ih with Cs+ increased the Rin of the neurone and abolished the sag in the voltage response to hyperpolarizing current pulses of increasing intensity (20 pA step).
Figure 8
Figure 8. Low-threshold Na+ current in AH neurones
A and B, currents induced by slowly (25 mV s−1) depolarizing AH neurones according to the voltage programme shown in A, before (control) and after replacing 90 % of Na+ by N-methyl d-glucamine chloride (NMDG). Lower traces, difference currents showing the sodium-dependent currents. A, NMDG strongly depressed Ih and revealed the presence of an inward current at voltages more positive than −50 mV. B, same experiment performed in the presence of Cs+ (2 mm) in order to block Ih. NMDG suppressed a low-threshold, slowly inactivating sodium-dependent current (shown as a difference current Bb). This current results in a negative slope conductance in the control I-V curve as shown in Ba. C, AH neurone submitted to voltage ramps at different speeds (50, 25 and 10 mV s−1). As the ramp became slower, the amplitude of the sodium-dependent current decreased as a result of more effective inactivation. D, effect of TTX (1 μm) on the slowly inactivating Na+ current and INaT. Da and Db, experiments performed in the presence of 2 mm Cs+. Da, currents induced by depolarizing an AH neurone (40 mV s−1) with voltage ramps from −100 to −20 mV before (control) and 20, 40 and 120 s after bath application of 1 μm TTX. Db, current traces of INaT induced by applying a voltage pulse of 17.5 ms from −70 to −30 mV before (control) and 5, 10 and 20 s after bath application of 1 μm TTX. INaT was abolished in less than 20 s.
Figure 9
Figure 9. Slow AHP current (IAHP) in AH neurones
A, method for quantifying the slow IAHP. Aa, the neurone was depolarized with two successive voltage ramps from −120 to 0 mV separated by 2 s. The first ramp (trace 1) induced a Ca2+ entry that activated IAHP, which was prominent in trace 2. Ab, IAHP was obtained by subtracting the first current trace from the second. It was fitted to the Goldman-Hodgkin-Katz relationship (open circles) to determine the permeability (p). The current decrease that occurred at voltages positive to −20 mV actually resulted from the slow inactivation of the delayed-rectifier K+ current during the first ramp. B, distribution of the AHP permeability in 36 AH neurones. C, K+ dependence of the reversal potential of the AHP current. Ca, AHP currents at three different values of [K+]o. Experiment performed in the presence of 2 mm Cs+. Arrows indicate the reversal potential of the AHP current. The presence of Cs+ tended to block the inwardly flowing IAHP in a voltage-dependent manner (i.e. the block increased with the cell polarization). This effect was particularly prominent when the inward IAHP was increased with high [K+]o. Cb, semi-logarithmic plot of the AHP reversal potential versus [K+]o. Data from two neurones. The straight line has a slope of 56 mV for a 10-fold change in [K+]o.
Figure 10
Figure 10. Activation of the slow AHP current with caffeine
Caffeine (1 mm) and 10 mm BAPTA were included in the pipette saline. A, progressive activation of IAHP after breaking the patch membrane. IAHP was visualized with successive voltage ramps from −120 to −20 mV. Inset, caffeine-activated current obtained by subtracting the current after 320 s dialysis from the current recorded immediately after breaking the patch membrane (t = 40 s). B, spontaneous deactivation of the caffeine-induced AHP current. Inset, simultaneous changes in the neurone resting potential measured from the beginning of dialysis.
Figure 11
Figure 11. Pharmacological identification of Ca2+ current of AH neurones
All experiments were performed in the presence of the L-type Ca2+ channels blocker nicardipine (3 μm). A, action potentials recorded in control saline (Aa), and after adding 10 mm TEA (Ab). The elongated TEA-treated action potential was progressively shortened in the presence of Ω-conotoxin (Ω-CgTX) GVIA (0.5 μm) over a period of 80 s (Ab). Adding Ω-CgTX MVIIC (0.5 μm) to the Ω-CgTX GVIA-containing saline had no additional effect on the action potential shape (Ac). B, same type of experiment using first Ω-CgTX MVIIC (Bb), then Ω-CgTX MVIIA (0.5 μm) after a 5 min wash period with the TEA saline (Bc), and finally Ω-CgTX MVIIA plus Ω-CgTX MVIIC (Bc). At the end of the experiment, the Ω-CgTX-resistant action potential elongation was abolished with 0.5 mm Cd2+.

Similar articles

Cited by

References

    1. Baidan LV, Zholos AV, Shuba MF, Wood JD. Patch-clamp recording in myenteric neurones of guinea-pig small intestine. American Journal of Physiology. 1992a;262:G1074–1078. - PubMed
    1. Baidan LV, Zholos AV, Wood JD. Properties of calcium currents determined by patch-clamp recording in myenteric neurones from adult guinea-pig small intestine. Gastroenterology. 1992b;102:A420.
    1. Barry PH, Lynch JW. Liquid junction potentials and small cell effects in patch-clamp analysis. Journal of Membrane Biology. 1991;121:101–117. - PubMed
    1. Bornstein JC, Costa M, Furness JB, Lees GM. Electrophysiology and enkephalin immunoreactivity of identified myenteric plexus neurones of guinea-pig small intestine. Journal of Physiology. 1984;351:313–325. - PMC - PubMed
    1. Bornstein JC, Furness JB, Smith TK, Trussell DC. Synaptic responses evoked by mechanical stimulation of the mucosa in morphologically characterized myenteric neurons of the guinea-pig ileum. Journal of Neuroscience. 1991;11:505–518. - PMC - PubMed

Publication types

LinkOut - more resources