. 2002 Jan 15;538(Pt 2):495-515.
doi: 10.1113/jphysiol.2001.012334.

Whisker maps of neuronal subclasses of the rat ventral posterior medial thalamus, identified by whole-cell voltage recording and morphological reconstruction

Affiliations

Whisker maps of neuronal subclasses of the rat ventral posterior medial thalamus, identified by whole-cell voltage recording and morphological reconstruction

Michael Brecht et al. J Physiol. .

Abstract

Whole-cell voltage recordings were made in vivo in the ventral posterior medial nucleus (VPM) of the thalamus in urethane-anaesthetised young (postnatal day 16-24) rats. Receptive fields (RFs) on the whisker pad were mapped for 31 neurones, and 10 cells were recovered for morphological reconstruction of their dendritic arbors. Most VPM neurones had antagonistic subthreshold RFs that could be divided into excitatory and inhibitory whiskers. VPM cells comprised different classes, the most frequently occurring being single-whisker excitation (SWE) and multi-whisker excitation (MWE) cells. In SWE cells (36 % of VPM neurones), only principal whisker (PW) deflection evoked an EPSP and was followed by a single action potential (AP) or remained subthreshold. The depolarisation was terminated by a large, delayed IPSP. A stimulus evoked on average 0.74 +/- 0.46 APs (mean +/- S.D.) with short latency (8.1 +/- 1.0 ms) and small temporal scatter (0.31 +/- 0.23 ms dispersion of 50 % of the first APs). In MWE cells (29 % of VPM neurones), deflection of several whiskers evoked EPSPs. PW responses were either subthreshold EPSPs or consisted of an EPSP followed by one or several APs (0.96 +/- 0.99 APs per stimulus). AP responses were often associated with putative low-threshold calcium-dependent regenerative potentials and were followed by a small delayed IPSP. AP responses had a longer latency (12.3 +/- 2.6 ms) and larger temporal scatter (2.5 +/- 1.6 ms) than responses of SWE cells. MWE cells had a lower input resistance than SWE cells. The elongation of dendritic arbors along the representation fields of rows and arcs in VPM barreloids was weakly correlated with the subthreshold RF elongation along whisker rows and arcs, respectively. Evoked EPSP-AP responses exhibited a sharper directional tuning than subthreshold EPSPs, which in turn exhibited a sharper directional tuning than IPSPs. In conclusion, we document two main classes of VPM neurones. SWE cells responded with a precisely timed single AP to the deflection of the PW. In contrast, MWE cell RFs were more broadly tuned and the temporally dispersed multiple AP responses of these cells represented the degree of collective deflection of the PW and several adjacent whiskers.


Figures
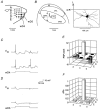
Figure 1
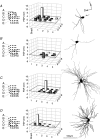
Figure 1. Soma-dendritic morphology and responses of a single-whisker excitation (SWE) cell
A, schematic representation of the whisker arrangement in the rat's face. B, left: schematic drawing of cell position in the rat thalamus. Right: coronal view of reconstruction of cell morphology. Both the thalamus and the cell have been rotated such that barreloids representing whisker rows run horizontally and barreloids representing whisker arcs run vertically. D = dorsal, L = lateral. C, two successive responses to principal whisker (PW; whisker D4) deflection. D, two successive responses to surround whisker (SuW; whisker D5) deflection. Onset and offset stimulus artefacts are seen in all records as small deflections. E, subthreshold responses to stimulus onset, dark bars refer to IPSPs, whereas light bars refer to EPSPs. F, action potential responses to stimulus onset. Whisker positions shaded grey in E and F refer to the responses shown in C and D.
Figure 2
Figure 2. Soma-dendritic morphology and responses of a multi-whisker excitation (MWE) cell
Conventions as in Fig. 1. A, schematic drawing of the whisker arrangement in the rat's face. B, left: schematic of cell position and barreloid rows in the rat thalamus. Right: coronal view of reconstruction of cell morphology. Both the thalamus and the cell have been rotated such that barreloids representing whisker rows run horizontally and those representing whisker arcs run vertically. C, two representative responses to PW (whisker E2) deflection. D, two responses to SuW (whisker E1) deflection. E, subthreshold responses to stimulus onset. F, AP responses to stimulus onset.
Figure 3
Figure 3. Classification and distribution of neurones from the ventral posterior medial nucleus of the thalamus (VPM) according to receptive field (RF) structure
IC = inhibitory centre; AWI = all-whisker inhibition.
Figure 4
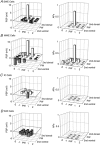
Figure 4. Averaged sub- and suprathreshold receptive field (RF) maps of different VPM neurones
Averaged RF plots for cells of RF types. Prior to averaging, RFs were aligned to the respective PW. Left column: subthreshold responses to stimulus onset. Only the first response peak was considered. Right column: suprathreshold (AP) responses to stimulus onset. A, SWE cell average. B, MWE cell average. C, IC cell average. D, AWI cell average. All AWI cells had asymmetric RFs in which the PW was bordering the whisker array. This asymmetry was preserved here by choosing an asymmetric RF plot and by mirror imaging one of the RFs before averaging.
Figure 5
Figure 5. Response amplitudes
A, average amplitudes of EPSPs, IPSPs, and AP responses for PW deflections. Error bars represent 1 s.d.B, average response amplitudes for the SuW deflections, which evoked the largest response. The values for EPSPs and IPSPs in MWE cells are from different whiskers. C, plot of AP counts evoked by airpuffs versus those evoked by single-whisker PW stimuli. For clarity only SWE and MWE cells are shown.
Figure 6
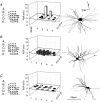
Figure 6. Dendrite morphology and subthreshold RFs of SWE cells
A-D, left: position of mapped whiskers; middle: subthreshold RFs of responses to stimulus onset. The first response peak is plotted. Right: coronal views of reconstructions of identified SWE cells. Cells have been rotated such that barreloids representing whisker rows run horizontally and those representing whisker arcs run vertically. The arrow indicates the initial part of the axon.
Figure 7
Figure 7. Dendrite morphology and subthreshold RF maps of a MWE cell, an AWI cell, and two high-threshold cells
A-D, left: position of mapped whiskers; middle: subthreshold RFs of responses to stimulus onset. The first response peak is plotted. Right: coronal views of reconstructions of identified cells. The arrow indicates the initial part of the axon. A, a MWE cell. B, an AWI cell. C, high-threshold cell. In this cell there were no consistent responses to the piezoelectric stimulator (see RF plots), but both cells responded to airpuffs, and to whisker stimuli delivered with a hand-held probe.
Figure 8
Figure 8. Membrane potential changes and AP responses for different RF types
A, SWE cell responses. Top: population average of potential changes to onset (left column) and offset (right column) of PW deflections. PON, POFF = stimulus artefacts. Middle: peristimulus time histograms (PSTHs) of individual cells. Bottom: population PSTH. Bin width in the PSTHs is 0.5 ms. B, MWE cell responses. Same conventions as in A. Stimulus artefacts are partially blanked.
Figure 9
Figure 9. Response latency
A, response latencies at different RF positions of a SWE cell. Records with median latencies were selected for each stimulus position. The latency of the inhibitory response was 9 ms for SuW D1 and 20 ms for SuW D4. The excitatory response and the AP are clipped. B, response latencies at different RF positions of a MWE cell; conventions as in A. The latency of the excitatory response was 6.5 ms for D2 (PW) and 12.5 ms for SuW δ, responses. C, average response latencies for PW stimulation (upper) and SuW stimulation (bottom). D, plot of the modal EPSP latency against modal AP latency for PW deflection. EPSP latency is the time to 5 % of the peak amplitude of the subthreshold response. AP latency is the time to AP peak. Stimulus artefacts are partially blanked.
Figure 10
Figure 10. Temporal scatter of SWE and MWE cell responses
A, ten superimposed responses to PW deflection in a SWE cell (upper panel) and a MWE cell (lower panel). Stimulus artefacts are partially blanked. B, ordered plot of the temporal dispersion of SWE and MWE AP responses. C, occurrence of AP bursts (several AP within 10 ms) in SWE and MWE cell responses.
Figure 11
Figure 11. Responses to different stimulus amplitudes
A, SWE cell responses to stimuli with different amplitudes for PW deflection (left column) and SuW deflection (right column). Records with modal response amplitudes are selected for each stimulus amplitude. In the uppermost trace on the left, the AP has been clipped. B, RF plots for the standard stimulus amplitude (6 °, left) and a very small stimulus amplitude (0.06 °, right). C, Distribution of various response components for different stimulus amplitudes for PW deflections (left) and SuW deflections. Stimulus artefacts are partially blanked.
Figure 12
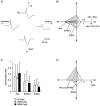
Figure 12. Responses to different stimulus directions
A, subthreshold responses to varying stimulus directions. PON = stimulator artefact. B, direction tuning of various response components, same cell as in A. C, directionality indices for various response components for a population of SWE and MWE cells. Values of 1 represent completely directional responses, values of 0 represent completely non-directional responses. Error bars represent 1 s.d.D, distribution of preferred directions for various response components. Stimulus artefacts are partially blanked.
Figure 13
Figure 13. Low-threshold Ca2+ potentials
Left column: A, current injection resulted as in almost all VPM cells in a regenerative depolarising potential. The regenerative potential resembled in its time course the low-threshold Ca2+ potentials (Steriade et al. 1997). B, ten responses to PW deflection recorded in the same MWE cell shown in A. Top: records in which depolarising regenerative potentials were triggered during the ON-response. Bottom: records, in which ON-responses remained subthreshold. APs have been clipped in A and B. Right column: depolarising potential triggered in the different conditions at higher temporal resolution.

Similar articles

Cited by

References

    1. Armstrong-James M. The functional status and columnar organization of single cells responding to cutaneous stimulation in neonatal rat somatosensory cortex S1. Journal of Physiology. 1975;246:501–538. - PMC - PubMed
    1. Armstrong-James M. The nature and plasticity of sensory processing within adult rat barrel cortex. In: Jones EG, Diamond IT, editors. The Barrel Cortex of Rodents. New York: Plenum; 1995. pp. 333–374.
    1. Armstrong M, Callahan C. Thalamocortical mechanisms in the formation of receptive fields of rat barrel cortex neurones. II. Spatiotemporal convergence in the thalamic ventroposterior medial nucleus (VPm) and its relevance to generation of receptive fields of S1 cortical “barrel” neurones. Journal of Comparative Neurology. 1991;303:211–224. - PubMed
    1. Arnold PB, Li CX, Waters RS. Thalocortical arbors extend beyond single cortical barrels: an in vivo tracing study in the rat. Experimental Brain Research. 2001;136:152–168. - PubMed
    1. Barbaresi P, Spreafico R, Frassoni C, Rustioni A. GABA-ergic neurons are present in the dorsal column nuclei but not in the ventroposterior complex of rats. Brain Research. 1986;382:305–326. - PubMed

LinkOut - more resources