

Magnetic resonance imaging analysis of cardiac cycle events in diabetic rats: the effect of angiotensin-converting enzyme inhibition
- PMID: 11790819
- PMCID: PMC2290083
- DOI: 10.1113/jphysiol.2001.012857
Magnetic resonance imaging analysis of cardiac cycle events in diabetic rats: the effect of angiotensin-converting enzyme inhibition
Abstract
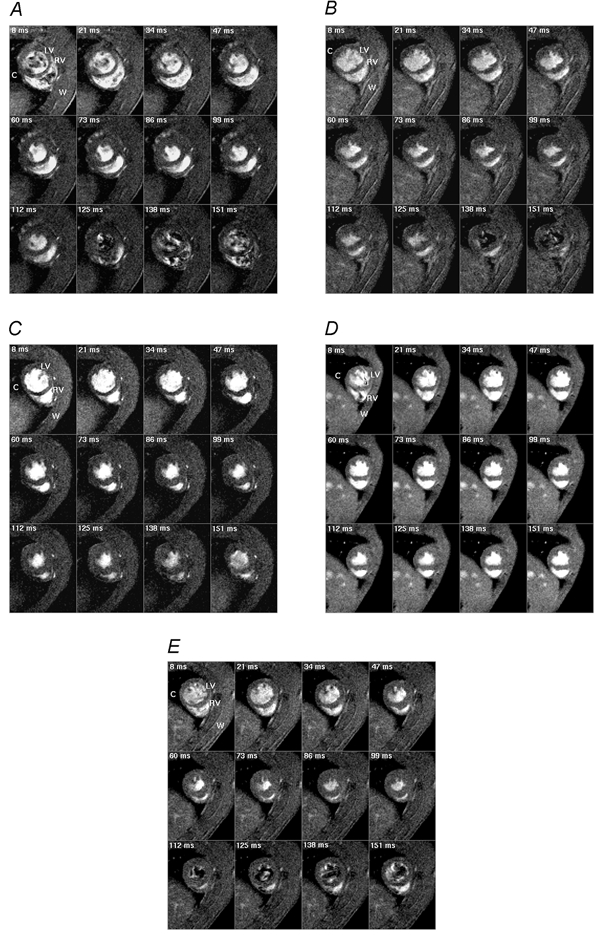
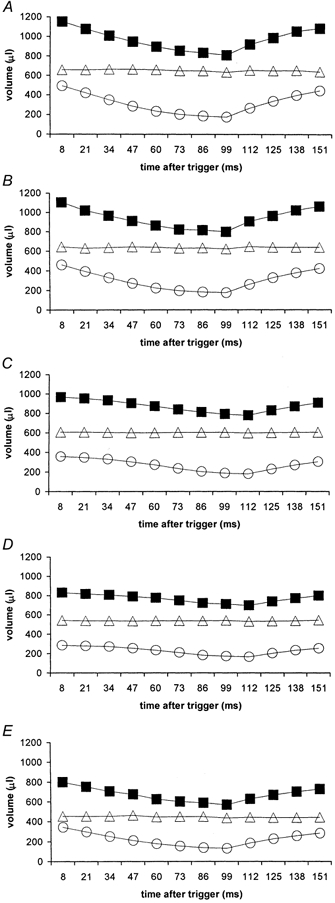
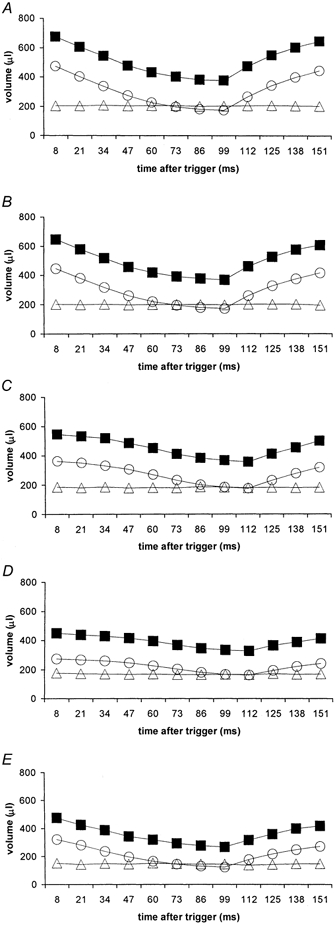
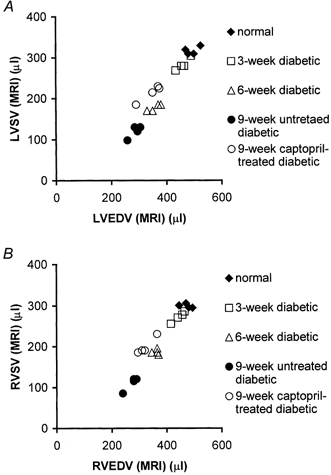
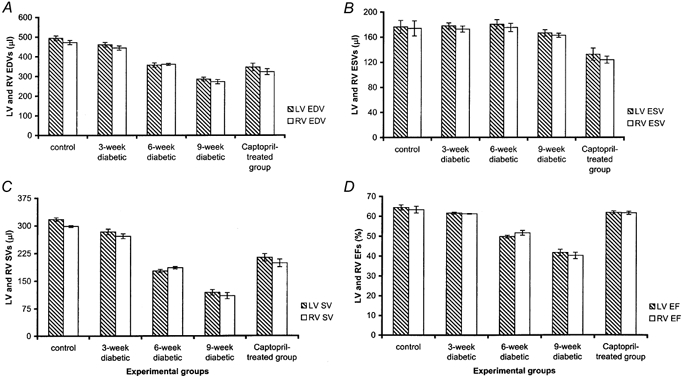
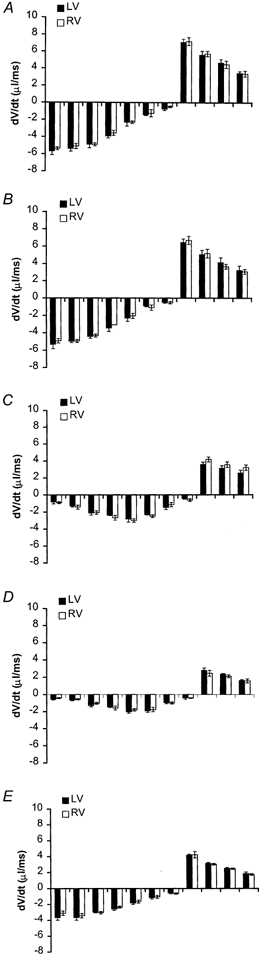
Non-invasive magnetic resonance imaging (MRI) was used to characterize changes in left and right ventricular cardiac cycles following induction of experimental, streptozotocin (STZ)-induced, diabetes in male Wistar rats at different ages. The effects of the angiotensin-converting enzyme (ACE) inhibitor captopril upon such chronic physiological changes were then evaluated, also for the first time. Diabetes was induced at the age of 7 weeks in two experimental groups, of which one group was subsequently maintained on captopril (2 g l(-1))-containing drinking water, and at 10 and 13 weeks in two further groups. The fifth group provided age-matched controls. All groups (each n = 4 animals) were scanned consistently at 16 weeks, in parallel with timings used in earlier studies that employed this experimental model. Cine magnetic resonance (MR) image acquisition provided transverse sections through both ventricles at twelve time points covering systole and most of diastole. These yielded reconstructions of cardiac anatomy used to derive critical functional indices and their dependence upon time following the triggering electrocardiographic R waves. The left and right ventricular end-diastolic (EDV), end-systolic (ESV) and stroke volumes (SV), and ejection fractions (EF) calculated from each, control and experimental, group showed matching values. This confirmed a necessary condition requiring balanced right and left ventricular outputs and further suggested that STZ-induced diabetes produced physiological changes in both ventricles. Absolute left and right ventricular SVs were significantly altered in all diabetic animals; EDVs and EFs significantly altered in animals diabetic from 7 and 10 but not 13 weeks. When normalized to body weight, left and right ventricular SVs had significantly altered in animals diabetic from 7 and 10 weeks but not 13 weeks. Normalized left ventricular EDVs were also significantly altered in animals diabetic from 7 and 10 weeks. However, normalized right ventricular EDVs were significantly altered only in animals made diabetic from 7 weeks. Diabetic hearts showed major kinetic changes in left and right ventricular contraction (ejection) and relaxation (filling). Both the initial rates of volume change (dV/dt) in both ventricles and the plots of dV/dt values through the cardiac cycle demonstrated more gradual developments of tension during systole and relaxation during diastole. Estimates of the derived left ventricular performance parameters of cardiac output, cardiac power output and stroke work in control animals were comparable with human values when normalized to both body (or cardiac) weight and heart rate. All deteriorated with diabetes. Comparisons of experimental groups diabetic from 7 weeks demonstrated that captopril treatment relieved the alterations in critical volumes, dependence of SV upon EDV, kinetics of systolic contraction and diastolic relaxation and in the derived indicators of ventricular performance. This study represents the first demonstration using non-invasive MRI of early, chronic changes in diastolic filling and systolic ejection in both the left and the right ventricles and of their amelioration by ACE inhibition following STZ-induction of diabetes in intact experimental animals.
Figures
Similar articles
-
Non-invasive magnetic resonance imaging assessment of myocardial changes and the effects of angiotensin-converting enzyme inhibition in diabetic rats.J Physiol. 2002 Jan 15;538(Pt 2):541-53. doi: 10.1113/jphysiol.2001.012856. J Physiol. 2002. PMID: 11790818 Free PMC article.
-
The ACE-inhibitor captopril improves myocardial perfusion in spontaneously diabetic (BB) rats.Diabetologia. 1995 May;38(5):509-17. doi: 10.1007/BF00400718. Diabetologia. 1995. PMID: 7489832
-
Time course of spirapril-induced structural and functional changes after myocardial infarction in rats followed with magnetic resonance imaging.J Cardiovasc Pharmacol. 1993 Jun;21(6):937-46. doi: 10.1097/00005344-199306000-00014. J Cardiovasc Pharmacol. 1993. PMID: 7687720
-
Effect of angiotensin-converting enzyme inhibitors on ventricular remodeling and survival following myocardial infarction.Ann Pharmacother. 1993 Jun;27(6):755-66. doi: 10.1177/106002809302700617. Ann Pharmacother. 1993. PMID: 8329800 Review.
-
Angiotensin-converting enzyme inhibitors: more different than alike? Focus on cardiac performance.Am J Cardiol. 1993 Dec 30;72(20):25H-36H. doi: 10.1016/0002-9149(93)91052-j. Am J Cardiol. 1993. PMID: 8285179 Review.
Cited by
-
Effect of streptozotocin-induced diabetes on left ventricular function in adult rats: an in vivo Pinhole Gated SPECT study.Cardiovasc Diabetol. 2007 Oct 15;6:30. doi: 10.1186/1475-2840-6-30. Cardiovasc Diabetol. 2007. PMID: 17937784 Free PMC article.
-
Non-invasive magnetic resonance imaging assessment of myocardial changes and the effects of angiotensin-converting enzyme inhibition in diabetic rats.J Physiol. 2002 Jan 15;538(Pt 2):541-53. doi: 10.1113/jphysiol.2001.012856. J Physiol. 2002. PMID: 11790818 Free PMC article.
-
Current status of cardiac MRI in small animals.MAGMA. 2004 Dec;17(3-6):149-56. doi: 10.1007/s10334-004-0066-4. Epub 2004 Dec 16. MAGMA. 2004. PMID: 15605278 Review.
-
Treatment with a copper-selective chelator causes substantive improvement in cardiac function of diabetic rats with left-ventricular impairment.Cardiovasc Diabetol. 2013 Jan 31;12:28. doi: 10.1186/1475-2840-12-28. Cardiovasc Diabetol. 2013. PMID: 23368770 Free PMC article.
-
Organ-based response to exercise in type 1 diabetes.ISRN Endocrinol. 2012;2012:318194. doi: 10.5402/2012/318194. Epub 2012 Dec 2. ISRN Endocrinol. 2012. PMID: 23251813 Free PMC article.
References
-
- Afzal N, Ganguly PK, Dhalla KS, Pierce GN, Signal PK, Dhalla NS. Beneficial effects of verapamil in diabetic cardiomyopathy. Diabetes. 1988;37:937–942. - PubMed
-
- Ahmed SS, Jaferi GA, Narang RM, Regan TJ. Pre-clinical abnormalities of left ventricular function in diabetes mellitus. American Heart Journal. 1975;89:153–158. - PubMed
-
- Airaksinen KEJ, Ikäheimo M, Kaila J, Linnaluoto M, Takkumen J. Impaired left ventricular filling in young female diabetics. An echocardiographic study. Acta Medica Scandinavica. 1984a;216:509–516. - PubMed
-
- Airaksinen KEJ, Ikäheimo M, Kaila J, Linnaluoto M, Takkunen J. Systolic time intervals and the QT-QS2 interval in young female diabetics. Annals of Clinical Research. 1984b;16:188–191. - PubMed
-
- Airaksinen KEJ, Ikäheimo MJ, Linnaluoto MK, Huikuri HV, Takkumen JT. Increased left atrial size relative to left ventricular size in young women with insulin dependent diabetes: a pre-clinical sign of the specific heart disease of diabetes? Diabetes Research. 1987;6:37–41. - PubMed
Publication types
MeSH terms
Substances
LinkOut - more resources
Full Text Sources
Miscellaneous