. 2002 Feb;11(2):301-12.
doi: 10.1110/ps.29402.

Toward genomic identification of beta-barrel membrane proteins: composition and architecture of known structures

Affiliations

Toward genomic identification of beta-barrel membrane proteins: composition and architecture of known structures

William C Wimley. Protein Sci. 2002 Feb.

Abstract

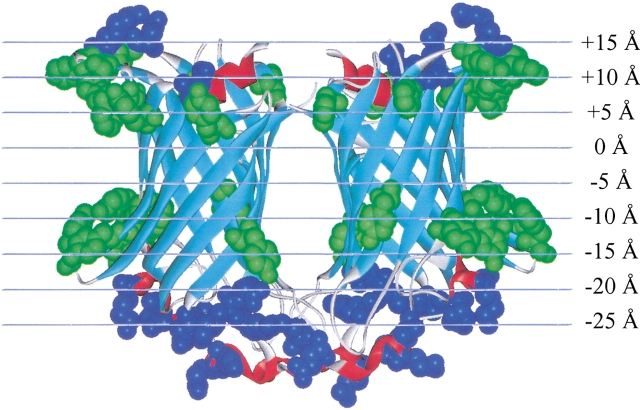
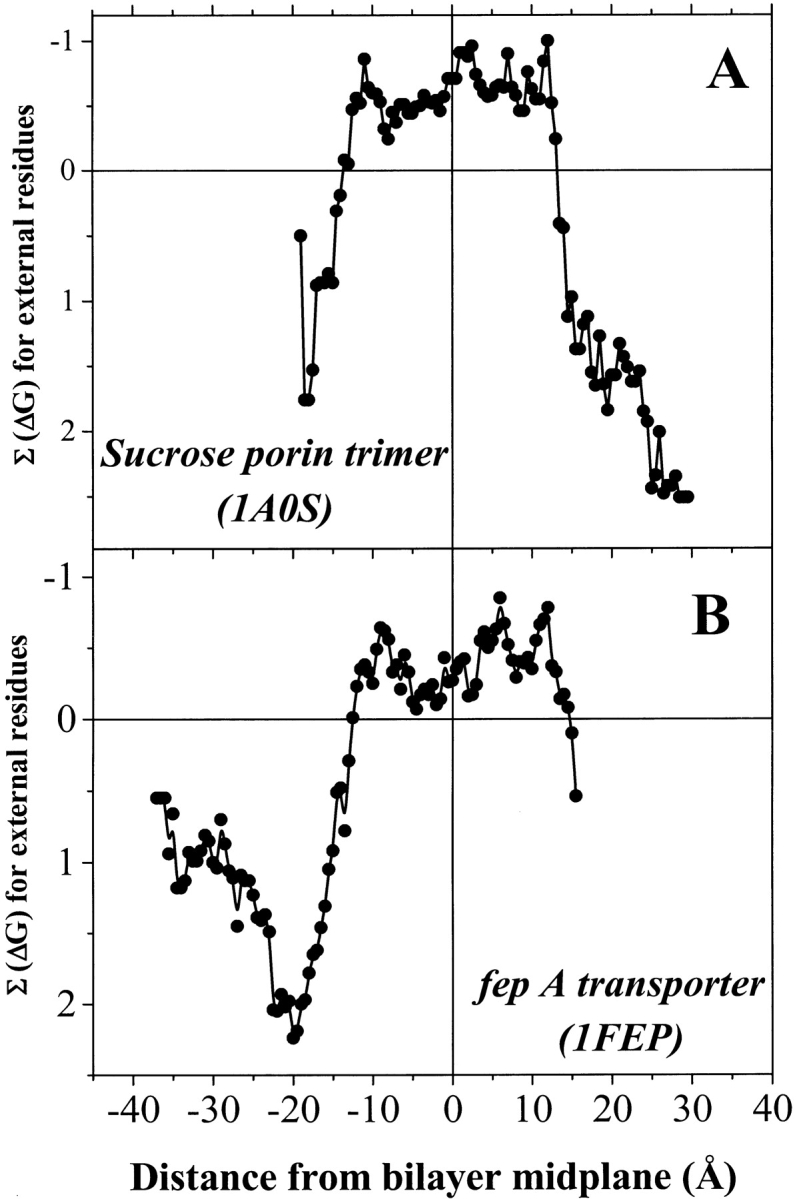
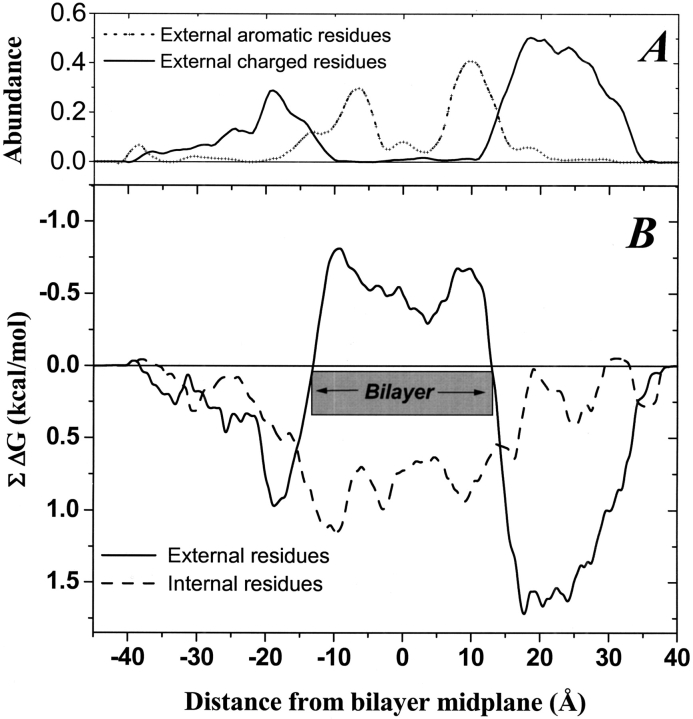
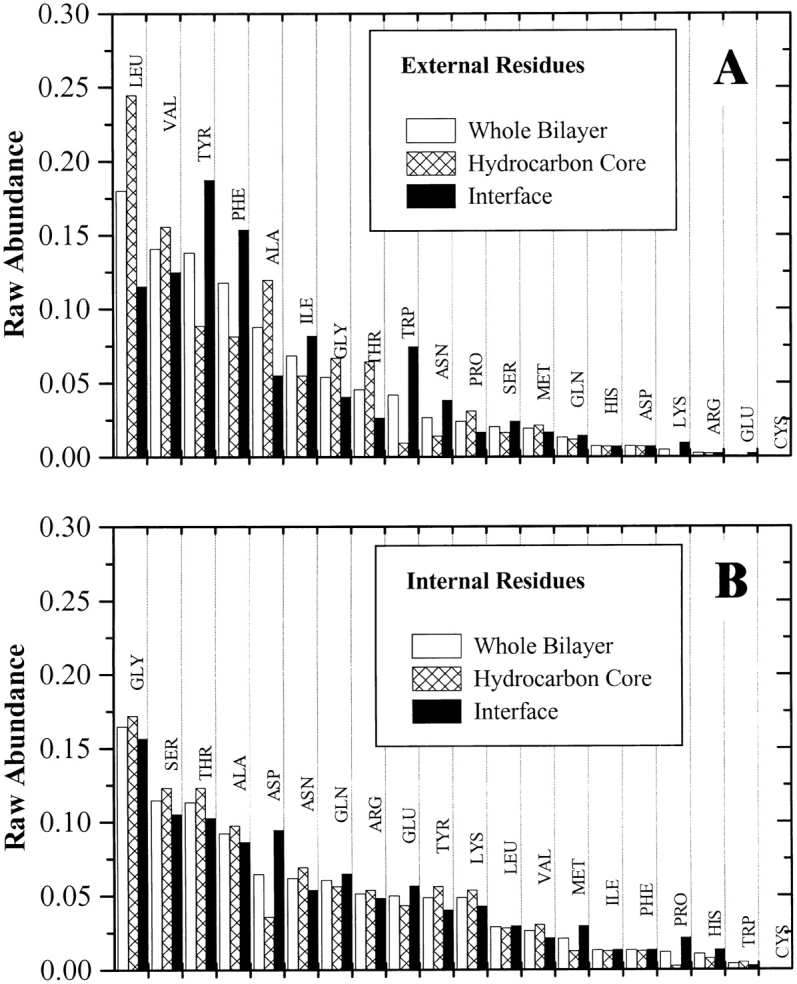
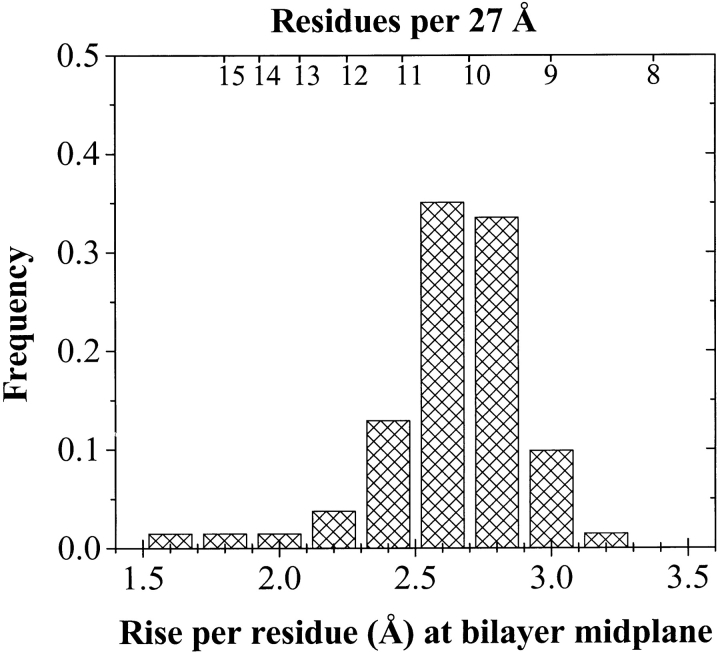
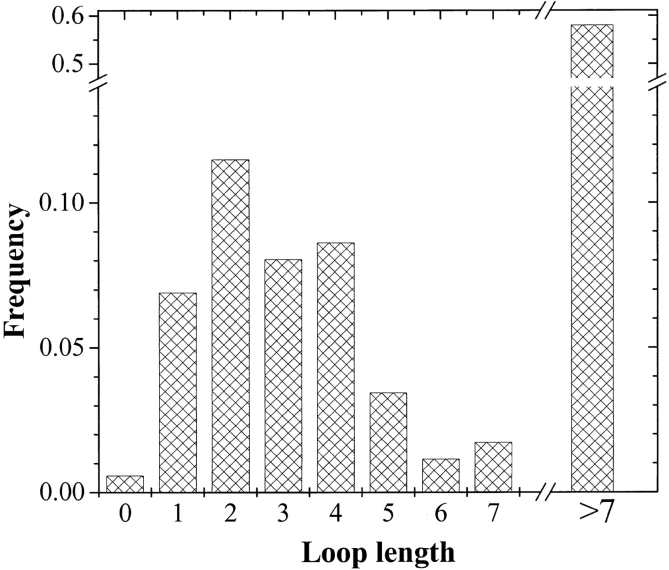
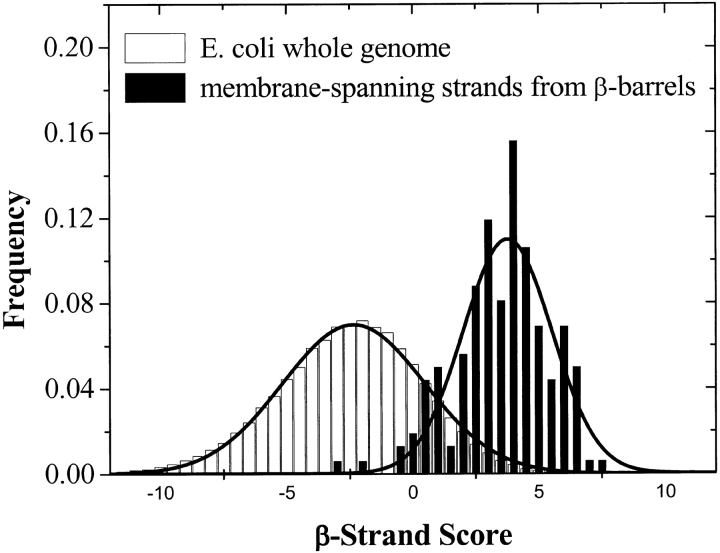
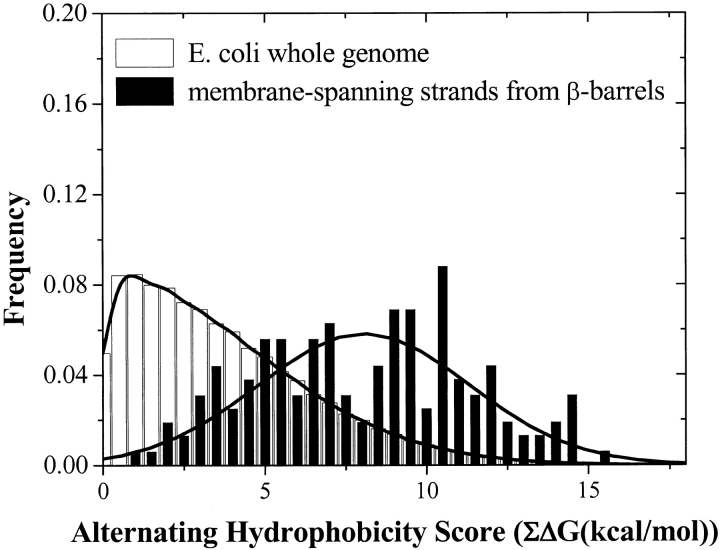
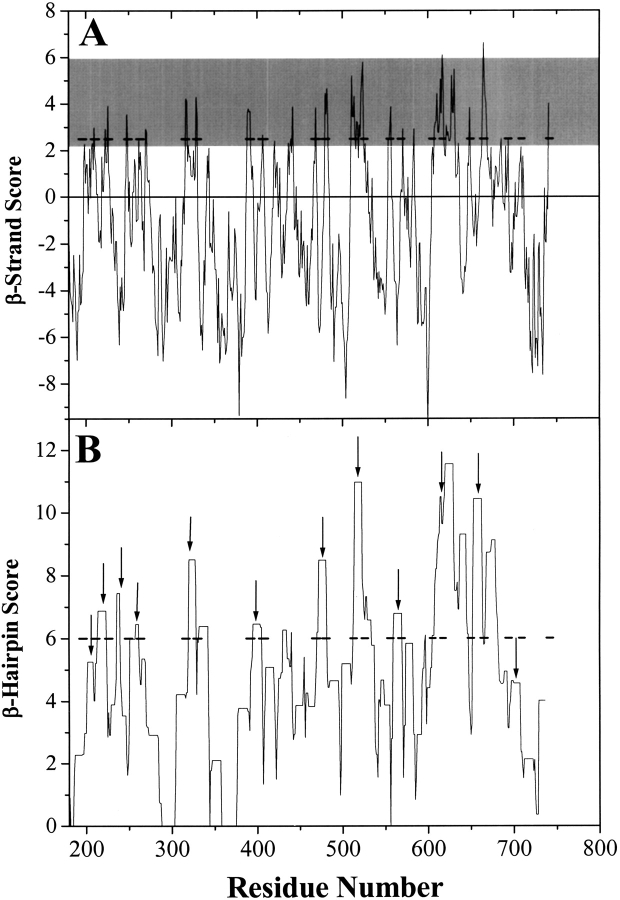
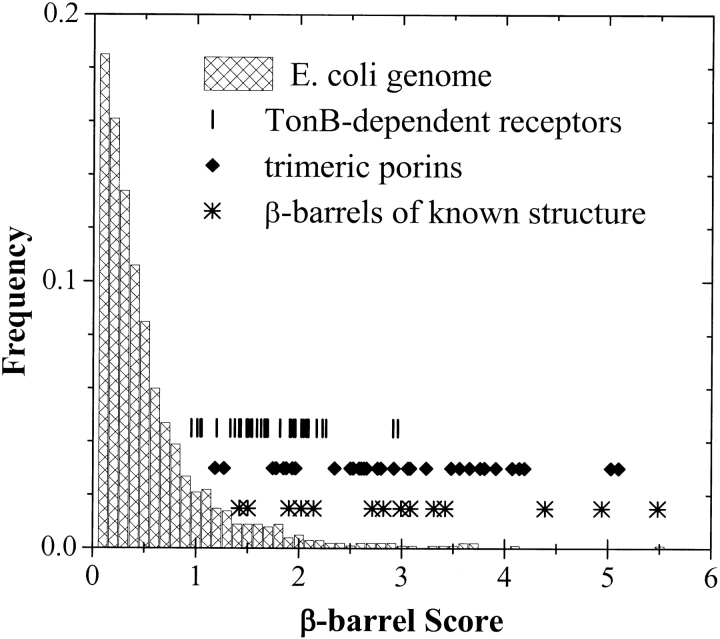
The amino acid composition and architecture of all beta-barrel membrane proteins of known three-dimensional structure have been examined to generate information that will be useful in identifying beta-barrels in genome databases. The database consists of 15 nonredundant structures, including several novel, recent structures. Known structures include monomeric, dimeric, and trimeric beta-barrels with between 8 and 22 membrane-spanning beta-strands each. For this analysis the membrane-interacting surfaces of the beta-barrels were identified with an experimentally derived, whole-residue hydrophobicity scale, and then the barrels were aligned normal to the bilayer and the position of the bilayer midplane was determined for each protein from the hydrophobicity profile. The abundance of each amino acid, relative to the genomic abundance, was calculated for the barrel exterior and interior. The architecture and diversity of known beta-barrels was also examined. For example, the distribution of rise-per-residue values perpendicular to the bilayer plane was found to be 2.7 +/- 0.25 A per residue, or about 10 +/- 1 residues across the membrane. Also, as noted by other authors, nearly every known membrane-spanning beta-barrel strand was found to have a short loop of seven residues or less connecting it to at least one adjacent strand. Using this information we have begun to generate rapid screening algorithms for the identification of beta-barrel membrane proteins in genomic databases. Application of one algorithm to the genomes of Escherichia coli and Pseudomonas aeruginosa confirms its ability to identify beta-barrels, and reveals dozens of unidentified open reading frames that potentially code for beta-barrel outer membrane proteins.


Figures

Fig. 1.
Fig. 1.
Molecular graphics image of a β-barrel outer membrane protein, the dimeric phospholipase OmpLA (Snijder et al. 1999). In this image we show the interfacial aromatic residues tryptophan and tyrosine in green and external charged residues in blue. These residues were used to orient the dimer in the bilayer plane (see text). The grid superimposed over the structure shows the protein in the bilayer-coordinate system that it was transformed to by the procedures described in the text.
Fig. 2.
Fig. 2.
Examples of external hydrophobicity profiles for two β-barrels. (A) The trimeric 18-stranded sucrose porin from Salmonella typhimurium (Table 1). (B) The monomeric 22-stranded iron transport protein fepA from Escherichia coli (Table 1). A 5-Å sliding window was used to generate hydrophobicity profiles for exposed barrel residues that were identified and centered on the bilayer midplane as described in the text. The hydrophobicity scale used was an experimentally determined scale based on partitioning of model peptides into octanol. Negative numbers on the X-axis signify residues closer to the periplasmic space. Negative numbers of the Y-axis signify residues that are more hydrophobic.
Fig. 3.
Fig. 3.
Composite transbilayer profiles for all β-barrel membrane proteins of known structure. (A) Fractional abundance of external aromatic and ionized residues summed over a 5-Å sliding window. The abundance is divided by the total number of external residues within the window. (B) Composite hydrophobicity of internal and exposed amino acids in the β-barrel membrane proteins of known structure (Table 1). The hydrophobicity scale is an absolute scale based on octanol partitioning of model peptides (Wimley et al. 1996), and was calculated using a 5-Å sliding window. Negative numbers on the X-axis signify residues closer to the periplasmic space, and negative numbers on the Y-axis of (B) signify greater hydrophobicity. The hydrophobic thickness of the membrane, 27 Å, is centered on X = 0 Å, and is shown as a gray box. Note that the hydrophobicity scale is an absolute scale that has not been normalized. The fact that the natural zero level of the octanol scale corresponds exactly to the actual membrane-spanning segments has been noted elsewhere for helical bundle membrane proteins applications (S. Jayasinghe, K. Hristova, and S.H. White 2001).
Fig. 4.
Fig. 4.
Raw amino acid abundance for the external and internal amino acids in the database of all known β-barrel membrane proteins. (A) External residues. (B) Internal residues. Raw abundance values are the total number of each amino acid divided by the total number of amino acids in that structural subclass. In addition to the abundance across the whole bilayer, we also show the abundance for each of two bilayer regimes, the hydrocarbon core ±6.5 Å from the bilayer midplane and the bilayer interface between 6.5 and 13.5 Å from the midplane. Abundance values are ranked, left to right, by the value for the whole bilayer.
Fig. 5.
Fig. 5.
Normalized amino acid abundance for the external and internal amino acids in the database of all known β-barrel membrane proteins. (A) External residues. (B) Internal residues. Normalized abundance values are the raw abundance (Fig. 4 ▶, Table 2) divided by the weighted genomic abundance of each amino acid (see text). In addition to the abundance across the whole bilayer, we also show the abundance for each of two bilayer regimes: the hydrocarbon core ±6.5 Å from the bilayer midplane and the bilayer interface between 6.5 and 13.5 Å from the midplane. The line at 1.0 is the expectation value for residues whose abundance equals the expected genomic abundance. Abundance values are ranked, left to right, by the value for the whole bilayer.
Fig. 6.
Fig. 6.
Histogram of the rise per residue in β-barrel membrane proteins of known structure. For each lipid-exposed β-strand in our database we calculated the rise per residue from the three residues closest to the bilayer midplane. The scale at the top shows a conversion to the number of residues required to span the 27-Å thickness of the membrane.
Fig. 7.
Fig. 7.
Histogram of interstrand loop lengths in the known β-barrel membrane proteins. In this measurement, a loop is a count of all the residues between two β-strands that are outside of the bilayer, more than 13.5 Å from the bilayer midplane. The distribution is bimodal, with about 45% of the loops shorter than eight residues and 55% of the loops longer.
Fig. 8.
Fig. 8.
Distribution of β-strand scores for the whole Escherichia coli genome (Perna et al. 2001) and for the membrane-spanning β-strands of known β-barrel proteins (Table 1). β-Strand scores reflect the match between the composition of alternating amino acids in an unknown segment and the composition expected from the analysis of known β-barrels. Calculation of β-strand scores is described in the text. Note that the center of the distribution of known β-barrel membrane protein is at about 2.5 σ from the genomic peak.
Fig. 9.
Fig. 9.
Distribution of alternating hydrophobicity scores for the whole Escherichia coli genome (Perna et al. 2001) and for the membrane-spanning β-strands of known β-barrel proteins (Table 1). Alternating hydrophobicity scores reflect the idea that the residues on the inside and outside of a β-barrel will have a hydrophobic-hydrophilic pattern. Calculation of abundance scores is described in the text. The value cannot be negative because we take the highest positive score of the two possible scores for the 10-residue window. Note that the overlap is much greater than the overlap in Figure 8 ▶, and thus, alternating hydrophobicity is a weaker detection method than the abundance comparison in Figure 8 ▶.
Fig. 10.
Fig. 10.
Examples of sliding window scores for the membrane-spanning segment of FhuA, a monomeric 22-stranded β-barrel (Table 1). The actual membrane-spanning strands are shown by the horizontal bars. (A) β-Strand score calculated as described in the text. A membrane-spanning β-strand will have a sharp peak. The gray box represents the area in which most known membrane-spanning β-strands fall. Note that every β-strand in this protein has a corresponding peak in this regime. (B) β-Hairpin score is the sum, in a 25-residue sliding window, of the highest peak in residues 1–10 and the highest peak in residues 15–25. Arrows denote the location of the short turns between known β-strands. Note that most of the β-hairpins in the protein are correctly identified.
Fig. 11.
Fig. 11.
Distribution of β-barrel scores for all proteins in the E. coli genome and in sets of known β-barrel membrane proteins. The known proteins are from three groups: known structures from the protein data bank (Table 1), trimeric porins, and TonB-dependent outer membrane receptors. Note that the known outer membrane proteins have scores that fall well beyond the mean of the E. coli distribution, 0.4.

References

    1. Alm, R.A., Bina, J., Andrews, B.M., Doig, P., Hancock, R.E., and Trust, T.J. 2000. Comparative genomics of Helicobacter pylori: Analysis of the outer membrane protein families. Infect. Immun. 684155–4168. - PMC - PubMed
    1. Altschul, S.F., Gish, W., Miller, W., Myers, E.W., and Lipman, D.J. 1990. Basic local alignment search tool. J. Mol. Biol. 215403–410. - PubMed
    1. Benz, R. 1994. Permeation of hydrophilic solutes through mitochondrial outer membranes: Review on mitochondrial porins. Biochim. Biophys. Acta 1197167–196. - PubMed
    1. Berman, H.M., Westbrook, J., Feng, Z., Gilliland, G., Bhat, T.N., Weissig, H., Shindyalov, I.N., and Bourne, P.E. 2000. The Protein Data Bank. Nucleic Acids Res. 28235–242. - PMC - PubMed
    1. Bishop, C.M., Walkenhorst, W.F., and Wimley, W.C. 2001. Folding of β-sheet membrane proteins: Specificity and promiscuity in peptide model systems. J. Mol. Biol. 309975–988. - PubMed

Publication types

LinkOut - more resources