. 2002 Feb;70(2):461-71.
doi: 10.1086/338759. Epub 2002 Jan 8.

A perspective on epistasis: limits of models displaying no main effect

Affiliations

A perspective on epistasis: limits of models displaying no main effect

Robert Culverhouse et al. Am J Hum Genet. 2002 Feb.

Abstract

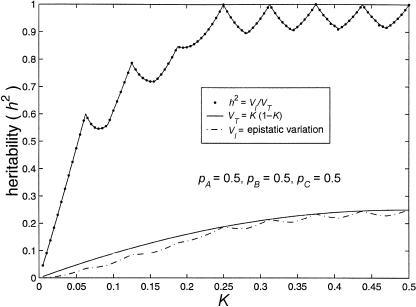
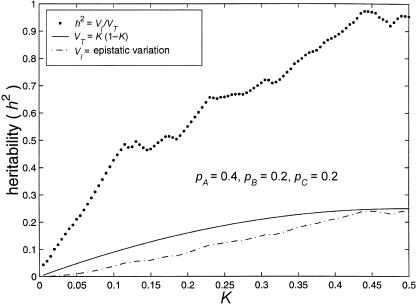
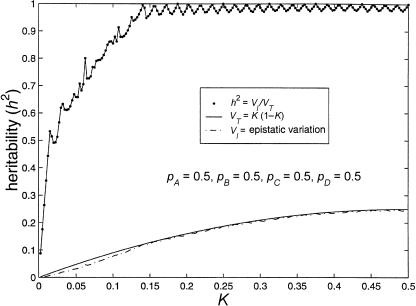
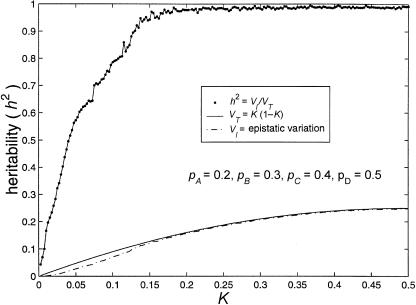
The completion of a draft sequence of the human genome and the promise of rapid single-nucleotide-polymorphism-genotyping technologies have resulted in a call for the abandonment of linkage studies in favor of genome scans for association. However, there exists a large class of genetic models for which this approach will fail: purely epistatic models with no additive or dominance variation at any of the susceptibility loci. As a result, traditional association methods (such as case/control, measured genotype, and transmission/disequilibrium test [TDT]) will have no power if the loci are examined individually. In this article, we examine this class of models, delimiting the range of genetic determination and recurrence risks for two-, three-, and four-locus purely epistatic models. Our study reveals that these models, although giving rise to no additive or dominance variation, do give rise to increased allele sharing between affected sibs. Thus, a genome scan for linkage could detect genomic subregions harboring susceptibility loci. We also discuss some simple multilocus extensions of single-locus analysis methods, including a conditional form of the TDT.


Figures

Figure  1
Figure 1
Limits of two-locus, biallelic, purely epistatic (i.e., VA=VD=0 at each locus) models, with all alleles equally frequent. The bottom curve represents the maximum variance due to genotype (i.e., VI), the middle curve represents the total variance as a function of disease prevalence (i.e., VT=K(1-K)), and the top curve represents the maximum proportion of variance attributable to genotype (i.e., h2=VI/VT).
Figure  2
Figure 2
Limits of three-locus, biallelic, purely epistatic (i.e., VA=VD=0 at each locus) models, with all alleles equally frequent. The bottom curve represents the approximate maximum variance due to genotype (i.e., VI), estimated by an iterative maximization algorithm from the SAS Institute (1995), the middle curve represents the total variance (i.e., VT=K(1-K)) as a function of disease prevalence, and the top curve represents the values for h2 that we have found for particular models; the dots on the top curve are the maximum proportion of variance attributable to genotype (i.e., h2=VI/VT), estimated by the iterative maximization method.
Figure  3
Figure 3
Limits of three-locus, biallelic, purely epistatic (i.e., VA=VD=0 at each locus) models. The bottom curve represents the estimated maximum variance due to genotype (i.e., VI), the middle curve represents the total variance (i.e., VT=K(1-K)) as a function of disease prevalence, and the top curve represents the estimated maximum proportion of variance attributable to genotype (i.e., h2=VI/VT).
Figure  4
Figure 4
Limits of four-locus, biallelic, purely epistatic (i.e., VA=VD=0 at each locus) models, with all alleles equally frequent. The bottom curve represents the estimated maximum variance due to genotype (i.e., VI), the middle curve represents the total variance (i.e., VT=K(1-K) as a function of disease prevalence, and the top curve represents the estimated maximum proportion of variance attributable to genotype (i.e., h2=VI/VT).
Figure  5
Figure 5
Limits of four-locus, biallelic, purely epistatic (i.e., VA=VD=0 at each locus) models. The bottom curve represents the estimated maximum variance due to genotype (i.e., VI), the middle curve represents the total variance (i.e., VT=K(1-K)) as a function of disease prevalence, and the top curve represents the estimated maximum proportion of variance attributable to genotype (i.e., h2=VI/VT).
Figure  6
Figure 6
Comparison of maximum heritabilities for three-locus, purely epistatic models with (top curve) and without (bottom curve) two-locus interactions. The maximum heritabilities for two-locus, purely epistatic models (middle curve) are included as a reference.

References

Electronic-Database Information

    1. “cdd and cddplus Homepage,” http://www.ifor.math.ethz.ch/~fukuda/cdd_home/cdd.html

References

    1. Boerwinkle E, Chakraborty R, Sing CF (1986) The use of measured genotype information in the analysis of quantitative phenotypes in man. I. Models and analytical methods. Ann Hum Genet 50:181–194 - PubMed
    1. Collins A, Lonjou C, Morton NE (1999) Genetic epidemiology of single-nucleotide polymorphism. Proc Natl Acad Sci USA 96:15173–15177 - PMC - PubMed
    1. Cordell HJ, Todd JA, Bennett ST, Kawaguchi Y, Farrall M (1995) Two-locus maximum LOD score analysis of a multifactorial trait: joint consideration of IDDM2 and IDDM4 with IDDM1 in type 1 disease. Am J Hum Genet 57:920–934 - PMC - PubMed
    1. Craddock N, Khodel V, Van Eerdewegh P, Reich T (1995) Mathematical limits of multilocus models: the genetic transmission of bipolar disorder. Am J Hum Genet 57:690–702 - PMC - PubMed
    1. DeSalle R, Templeton AR (1986) The molecular through ecological genetics of abnormal abdomen in Drosophila mercatorum. III. Tissue-specific differential replication of ribosomal genes modulates the abnormal abdomen phenotype in Drosophila mercatorum. Genetics 112:877–886 - PMC - PubMed

Publication types