. 2002 Jan 22;99(2):786-90.
doi: 10.1073/pnas.012399899. Epub 2002 Jan 15.

Chemical warfare between microbes promotes biodiversity

Affiliations

Chemical warfare between microbes promotes biodiversity

Tamás L Czárán et al. Proc Natl Acad Sci U S A. .

Abstract

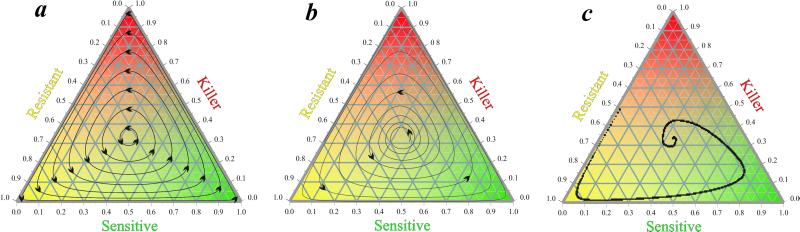
Evolutionary processes generating biodiversity and ecological mechanisms maintaining biodiversity seem to be diverse themselves. Conventional explanations of biodiversity such as niche differentiation, density-dependent predation pressure, or habitat heterogeneity seem satisfactory to explain diversity in communities of macrobial organisms such as higher plants and animals. For a long time the often high diversity among microscopic organisms in seemingly uniform environments, the famous "paradox of the plankton," has been difficult to understand. The biodiversity in bacterial communities has been shown to be sometimes orders of magnitudes higher than the diversity of known macrobial systems. Based on a spatially explicit game theoretical model with multiply cyclic dominance structures, we suggest that antibiotic interactions within microbial communities may be very effective in maintaining diversity.


Figures

Figure 1
Figure 1
The single-toxin RSP game. (a) Periodic orbits of the simplest RSP game dynamics. (b) Divergent oscillations in the simple RSP game with a small interaction cost added. (c) Stability of the spatial (cellular automaton) version of the simple RSP game model.
Figure 2
Figure 2
Multitoxin RSP game: frozen state. (a) Time series of the relative frequencies of K, R, and S phenotypes on an average toxin locus with different initial states. The yellow dotted line is the approximate “separatrix” between the “basins of attraction” for the frozen state and the generic hyperimmunity state. (b) Distribution of the numbers of K and R phenotypes per strain at different generations for the all-S initial state. Simulation type: 14 toxin loci; 180 × 180 grid; metabolic cost for killing is twice as large as for just resistance; all mutation rates are m = 10−5; no recombination (r = 0). T, time in generations.
Figure 3
Figure 3
Multitoxin RSP game: hyperimmunity state. Time series (a) and phenotype distribution (b) with r = 10−3 recombination rate. All other parameters are as described for Fig. 2. T, time in generations.

Comment in

  • Chemical warfare from an ecological perspective.
    Lenski RE, Riley MA. Lenski RE, et al. Proc Natl Acad Sci U S A. 2002 Jan 22;99(2):556-8. doi: 10.1073/pnas.022641999. Proc Natl Acad Sci U S A. 2002. PMID: 11805313 Free PMC article. No abstract available.

References

    1. Pace N R. Science. 1997;276:734–740. - PubMed
    1. Amann R I, Ludwig W, Schleifer K H. Microbiol Rev. 1995;59:143–169. - PMC - PubMed
    1. Torsvik V, Goksøyr J, Daae F L. Appl Environ Microbiol. 1990;56:782–787. - PMC - PubMed
    1. Dykhuizen D E. Antonie Leeuwenhoek. 1998;73:25–33. - PubMed
    1. Reeves P. The Bacteriocins. New York: Springer; 1972.

Publication types