Insulin sensitivity decreases with obesity, and lean cats with low insulin sensitivity are at greatest risk of glucose intolerance with weight gain
- PMID: 11795959
- PMCID: PMC10822293
- DOI: 10.1053/jfms.2001.0138
Insulin sensitivity decreases with obesity, and lean cats with low insulin sensitivity are at greatest risk of glucose intolerance with weight gain
Abstract
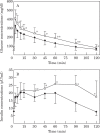
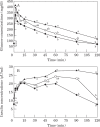
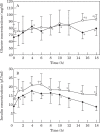
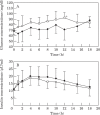
This study quantifies the effects of marked weight gain on glucose and insulin metabolism in 16 cats which increased their weight by an average of 44.2% over 10 months. Significantly, the development of feline obesity was accompanied by a 52% decrease in tissue sensitivity to insulin and diminished glucose effectiveness. In addition, glucose intolerance and abnormal insulin response occurred in some cats. An important finding was that normal weight cats with low insulin sensitivity and glucose effectiveness were at increased risk of developing impaired glucose tolerance with obesity. High basal insulin concentrations or low acute insulin response to glucose also independently increased the risk for developing impaired glucose tolerance. Male cats gained more weight relative to females and this, combined with their tendency to lower insulin sensitivity and higher insulin concentrations, may explain why male cats are at greater risk for diabetes. Results suggest an underlying predisposition for glucose intolerance in some cats, which is exacerbated by obesity. These cats may be more at risk of progressing to overt type 2 diabetes mellitus.
Copyright 2001 European Society of Feline Medicine.
Figures


Similar articles
-
Plasma leptin concentrations are independently associated with insulin sensitivity in lean and overweight cats.J Feline Med Surg. 2002 Jun;4(2):83-93. doi: 10.1053/jfms.2002.0166. J Feline Med Surg. 2002. PMID: 12027507 Free PMC article.
-
Dosing obese cats based on body weight spuriously affects some measures of glucose tolerance.Domest Anim Endocrinol. 2016 Oct;57:133-42. doi: 10.1016/j.domaniend.2016.05.007. Epub 2016 May 26. Domest Anim Endocrinol. 2016. PMID: 27572923
-
GLUT4 but not GLUT1 expression decreases early in the development of feline obesity.Domest Anim Endocrinol. 2004 May;26(4):291-301. doi: 10.1016/j.domaniend.2003.11.003. Domest Anim Endocrinol. 2004. PMID: 15063922
-
Pathogenesis of feline diabetes mellitus.Vet Clin North Am Small Anim Pract. 1995 May;25(3):527-52. doi: 10.1016/s0195-5616(95)50051-8. Vet Clin North Am Small Anim Pract. 1995. PMID: 7660530 Review.
-
The cat as a model for human obesity and diabetes.J Diabetes Sci Technol. 2012 May 1;6(3):525-33. doi: 10.1177/193229681200600306. J Diabetes Sci Technol. 2012. PMID: 22768882 Free PMC article. Review.
Cited by
-
Postprandial glycaemia in cats fed a moderate carbohydrate meal persists for a median of 12 hours--female cats have higher peak glucose concentrations.J Feline Med Surg. 2012 Oct;14(10):706-15. doi: 10.1177/1098612X12449702. Epub 2012 May 31. J Feline Med Surg. 2012. PMID: 22653915 Free PMC article.
-
Association of circulating adipokine concentrations with indices of adiposity and sex in healthy, adult client owned cats.BMC Vet Res. 2019 Sep 18;15(1):332. doi: 10.1186/s12917-019-2080-9. BMC Vet Res. 2019. PMID: 31533709 Free PMC article.
-
Dietary choline, but not L-carnitine, increases circulating lipid and lipoprotein concentrations, without affecting body composition, energy expenditure or respiratory quotient in lean and obese male cats during weight maintenance.Front Vet Sci. 2023 Jul 26;10:1198175. doi: 10.3389/fvets.2023.1198175. eCollection 2023. Front Vet Sci. 2023. PMID: 37565085 Free PMC article.
-
Effects of weight loss and feeding specially formulated diets on the body composition, blood metabolite profiles, voluntary physical activity, and fecal metabolites and microbiota of overweight cats.J Anim Sci. 2023 Jan 3;101:skad332. doi: 10.1093/jas/skad332. J Anim Sci. 2023. PMID: 37773637 Free PMC article.
-
ISFM consensus guidelines on the practical management of diabetes mellitus in cats.J Feline Med Surg. 2015 Mar;17(3):235-50. doi: 10.1177/1098612X15571880. J Feline Med Surg. 2015. PMID: 25701862 Free PMC article.
References
-
- Altman DG. (1991) Comparing groups—categorical data. In: Practical Statistics for Medical Research (1st edn). London: Chapman and Hall, pp. 266–268.
-
- Appleton DJ, Rand JS, Sunvold GD, et al. (2001) Determination of reference values for glucose tolerance, insulin tolerance and insulin sensitivity tests in clinically normal cats. American Journal of Veterinary Research 62, 630–636. - PubMed
-
- Beard JC, Bergman RN, Ward WK, et al. (1986) The insulin sensitivity index in nondiabetic man: correlation between clamp-derived and IVGTT-derived values. Diabetes 35, 362–369. - PubMed
Publication types
MeSH terms
Substances
LinkOut - more resources
Full Text Sources
Medical
Miscellaneous

