. 2002 Feb;70(2):470-80.
doi: 10.1128/IAI.70.2.470-480.2002.

Strain-dependent differences in the regulatory roles of sarA and agr in Staphylococcus aureus

Affiliations

Strain-dependent differences in the regulatory roles of sarA and agr in Staphylococcus aureus

Jon S Blevins et al. Infect Immun. 2002 Feb.

Abstract

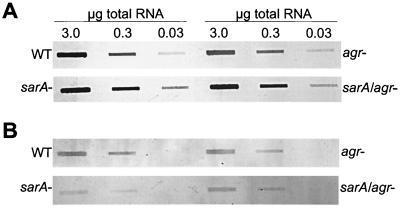
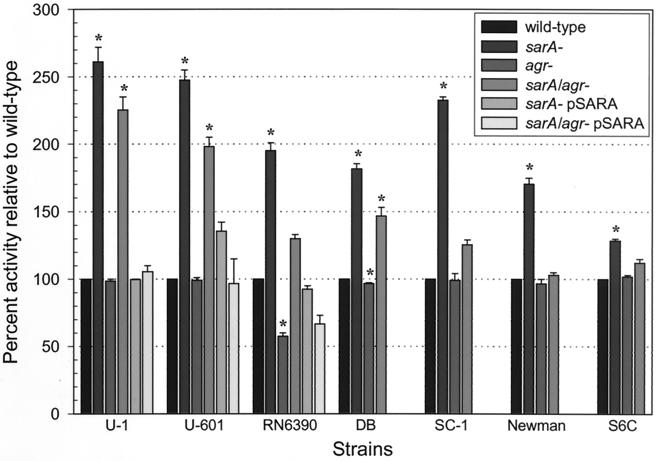
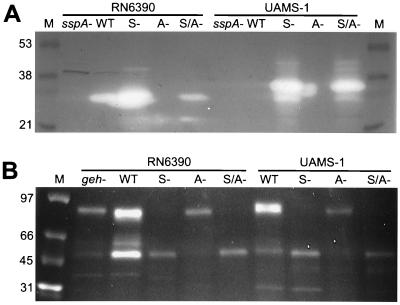
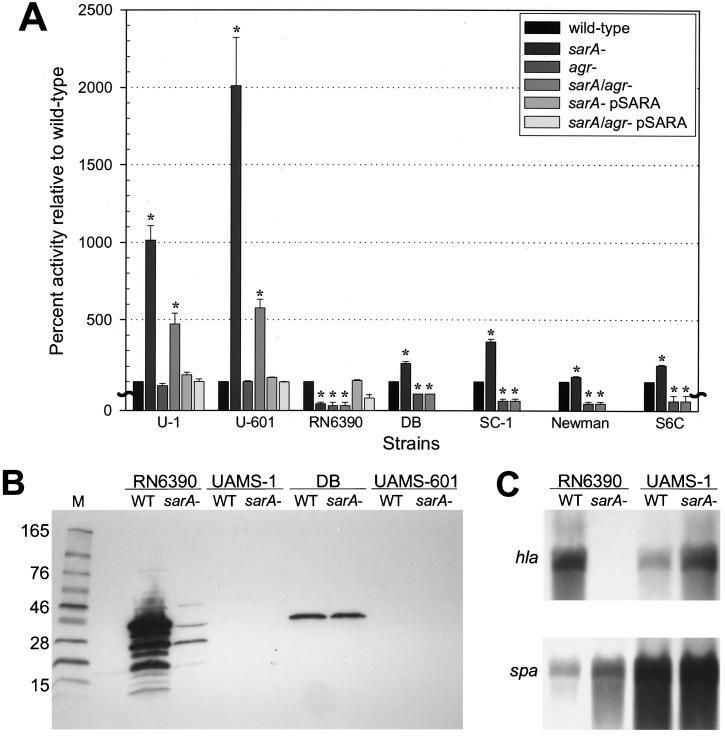
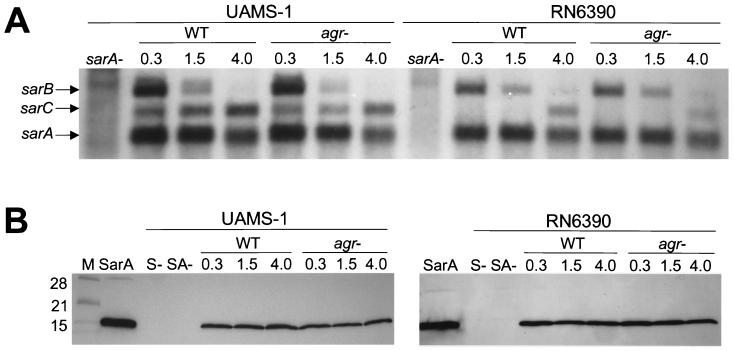
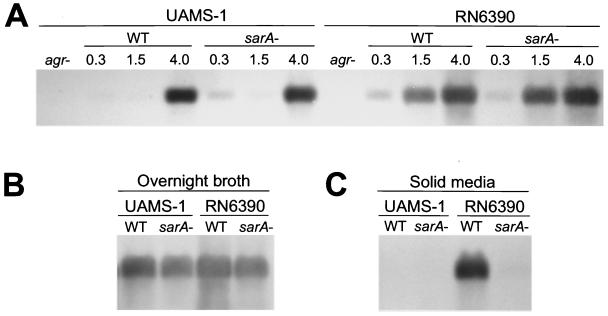
The accessory gene regulator (agr) and the staphylococcal accessory regulator (sar) are central regulatory elements that control the production of Staphylococcus aureus virulence factors. To date, the functions of these loci have been defined almost exclusively using RN6390, which is representative of the laboratory strain 8325-4. However, RN6390 was recently shown to have a mutation in rsbU that results in a phenotype resembling that of a sigB mutant (I. Kullik et al., J. Bacteriol. 180:4814-4820, 1998). For that reason, it remains unclear whether the regulatory events defined in RN6390 are representative of the events that take place in clinical isolates of S. aureus. To address this issue, we generated mutations in the sarA and agr loci of three laboratory strains (RN6390, Newman, and S6C) and four clinical isolates (UAMS-1, UAMS-601, DB, and SC-1). Mutation of sarA in the cna-positive strains UAMS-1 and UAMS-601 resulted in an increased capacity to bind collagen, while mutation of agr had little impact. Northern blot analysis confirmed that the increase in collagen binding was due to increased cna transcription. Without exception, mutation of sarA resulted in increased production of proteases and a decreased capacity to bind fibronectin. Mutation of agr had the opposite effect. Although mutation of sarA resulted in a slight reduction in fnbA transcription, changes in the ability to bind fibronectin appeared to be more directly correlated with changes in protease activity. Lipase production was reduced in both sarA and agr mutants. While mutation of sarA in RN6390 resulted in reduced hemolytic activity, it had the opposite effect in all other strains. There appeared to be reduced levels of the sarC transcript in RN6390, but there was no difference in the overall pattern of sar transcription or the production of SarA. Although mutation of sarA resulted in decreased RNAIII transcription, this effect was not evident under all growth conditions. Taken together, these results suggest that studies defining the regulatory roles of sarA and agr by using RN6390 are not always representative of the events that occur in clinical isolates of S. aureus.


Figures

FIG. 1.
FIG. 1.
Transcription of cna and fnb genes in UAMS-1 sarA and agr mutants. Northern slot blots were done with probes corresponding to cna (A) or fnbA (B). RNA samples were taken from cultures in the mid- to late-exponential growth phases (A560 ∼ 1.5). Numbers above the lanes in panel A correspond to the total amount of cellular RNA spotted in each well. The same amounts apply to the lanes in panel B. For densitometric analysis, light emission was determined, and the values obtained from all unsaturated lanes were averaged to derive the relative values summarized in Table 2. WT, wild type.
FIG. 2.
FIG. 2.
Protease activity in sarA and agr mutants. The proteolytic activity in cell-free culture supernatants was determined by using azocasein. The total protease activity in sarA and agr mutants is shown as the percent activity relative to the corresponding parent strain, which was arbitrarily set at 100%. Values represent the results of at least two independent assays, both of which were done in duplicate. Results are reported as the mean ± the standard error of the mean (SEM). Asterisks denote statistical significance (P < 0.05), as determined by using Student’s paired t test to compare each mutant to the corresponding parent strain. In the case of the pSARA-complemented sarA agr mutant, statistical significance was assessed based on comparison to the corresponding agr mutant. Because the value for all parent strains was set to 100%, this panel does not reflect differences in the amount of protease produced by each parent strain.
FIG. 3.
FIG. 3.
Zymogram analysis of protease and lipase production. Cell-free culture supernatants were concentrated by centrifugation and examined by using casein gels (A) or a direct fluorescence assay for lipase activity (B). The results obtained with RN6390 and UAMS-1 are shown for comparison. The results obtained with UAMS-1 were essentially identical to the results observed with UAMS-601 and DB (data not shown). The sspA mutant used as a negative control for RN6390 was generated in the wild-type strain. The sspA mutant used as a negative control for UAMS-1 was generated in the UAMS-1 sarA mutant because the wild-type strain did not produce detectable amounts of protease. The geh mutant used as a control in panel B is in the RN6390 background. WT, wild-type; S−, sarA mutant; A−, agr mutant; S/A−, sarA agr mutant. The lane marked “M” contains molecular size markers.
FIG. 4.
FIG. 4.
Hemolytic activity in sarA and agr mutants. (A) The total hemolytic activity in sarA and agr mutants is shown as the percent activity relative to the corresponding parent strain, which was arbitrarily set at 100%. Values represent the results of at least two independent assays, both of which were done in duplicate. Results are reported as the mean ± the SEM. Asterisks denote statistical significance (P < 0.05), as determined by using Student’s paired t test to compare each mutant to the corresponding parent strain. In the case of the pSARA-complemented sarA agr mutant, statistical significance was assessed based on comparison to the corresponding agr mutant. Because the value for all parent strains was set to 100%, this panel does not reflect differences in the amount of hemolytic activity produced by each parent strain. (B) Western blot analysis with an anti-Hla monoclonal antibody. Cell-free culture supernatants were concentrated by centrifugation prior to analysis. (C) Northern blot analysis of RNA isolated from cells in stationary phase with probes corresponding to hla (top) and spa (bottom). Densitometric analysis indicated that the increase in hla transcription in the UAMS-1 sarA mutant was ca. 2.5-fold. We also demonstrated, as a control, that mutation of sarA in RN6390 resulted in increased spa transcription, whereas it had little effect in UAMS-1 (C) or UAMS-601 (data not shown). WT, wild type.
FIG. 5.
FIG. 5.
Transcription of sar and production of SarA. (A) Northern blots were done by using a probe corresponding to sarA. The identity of the sar transcripts is indicated on the left. (B) Western blot done with polyclonal anti-SarA antibody. Purified SarA (4) was included as a control. In both panels, the numbers above each lane indicate the optical density (A560) of the culture at the time of RNA harvest (in panel A) or preparation of cell lysates (in panel B). WT, wild type; S−, sarA mutant; SA−, sarA agr mutant. The lane marked “M” contains molecular size markers.
FIG. 6.
FIG. 6.
Transcription of RNAIII. Northern blots were done by using a probe corresponding to RNAIII. (A) Time course with RNA isolated from cells grown in broth culture. The numbers above each lane indicate the optical density (A560) of the culture at the time of RNA harvest. (B) Northern blots done with RNA isolated from overnight (18-h) broth cultures. (C) Northern blots done with RNA harvested from cells grown overnight on TSA. WT, wild type.

Similar articles

Cited by

References

    1. Abdelnour, A., S. Arvidson, T. Bremell, C. Ryden, and A. Tarkowski. 1993. The accessory gene regulator (agr) controls Staphylococcus aureus virulence in a murine arthritis model. Infect. Immun. 61:3879–3885. - PMC - PubMed
    1. Bayer, M. G., J. H. Heinrichs, and A. L. Cheung. 1996. The molecular architecture of the sar locus in Staphylococcus aureus. J. Bacteriol. 178:4563–4570. - PMC - PubMed
    1. Bischoff, M., J. M. Entenza, and P. Giachino. 2001. Influence of a functional sigB operon on the global regulators sar and agr in Staphylococcus aureus. J. Bacteriol. 183:5171–5179. - PMC - PubMed
    1. Blevins, J. S., A. F. Gillaspy, T. M. Rechtin, B. K. Hurlburt, and M. S. Smeltzer. 1999. The staphylococcal accessory regulator (sar) represses transcription of the Staphylococcus aureus collagen adhesin gene (cna) in an agr-independent manner. Mol. Microbiol. 33:317–326. - PubMed
    1. Bohach, G. A., and T. J. Foster. 2000. Staphylococcus aureus exotoxins, p.367–378. In V. A. Fischetti, R. P. Novick, J. J. Ferretti, D. A. Portnoy, and J. I. Rood (ed.), Gram-positive pathogens. ASM Press, Washington, D.C.

Publication types

MeSH terms

LinkOut - more resources