. 2002 Feb;76(4):1673-81.
doi: 10.1128/jvi.76.4.1673-1681.2002.

Effect of latent human immunodeficiency virus infection on cell surface phenotype

Affiliations

Effect of latent human immunodeficiency virus infection on cell surface phenotype

David G Brooks et al. J Virol. 2002 Feb.

Abstract

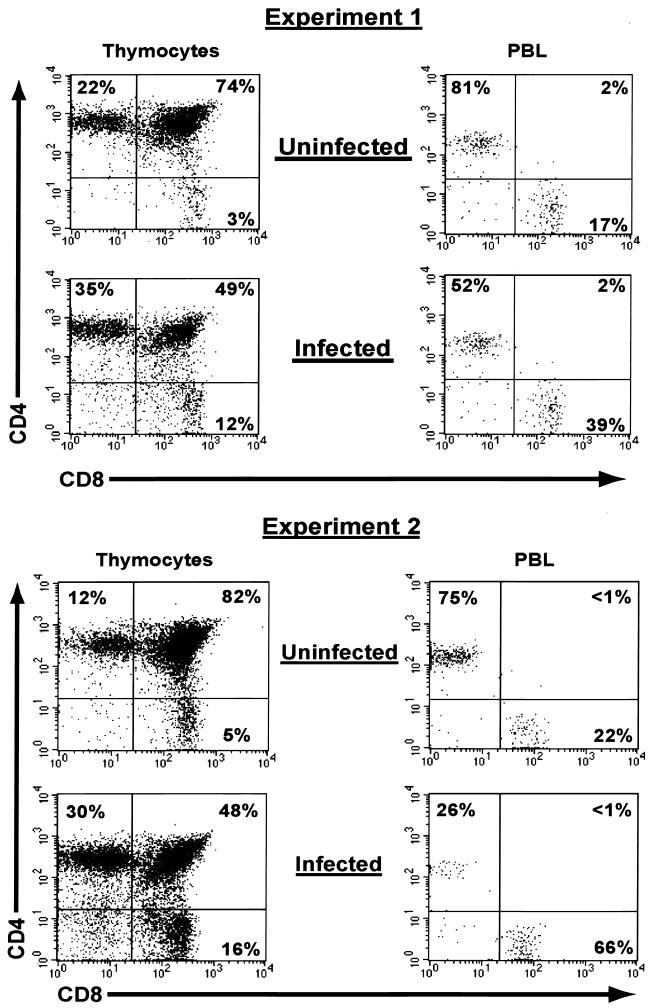
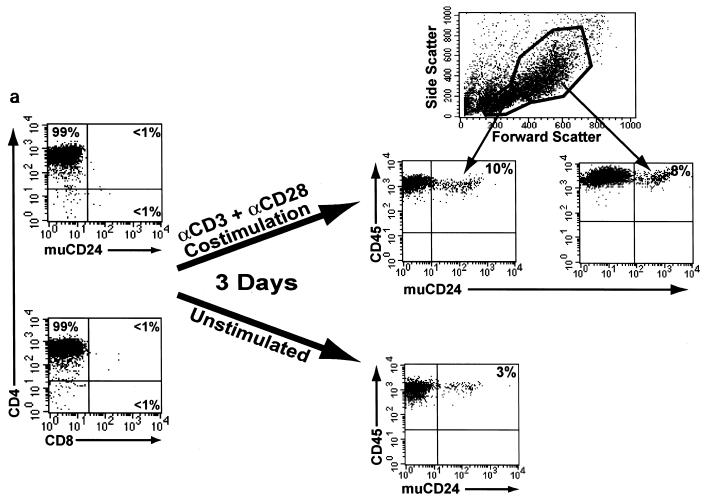
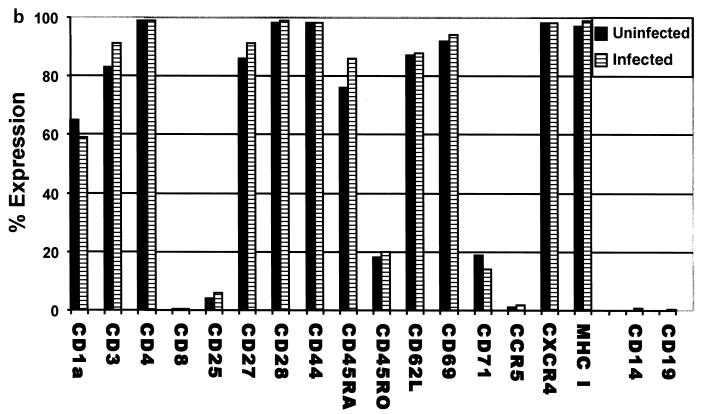
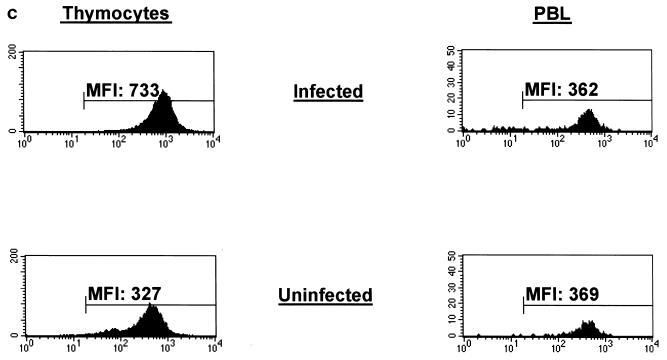
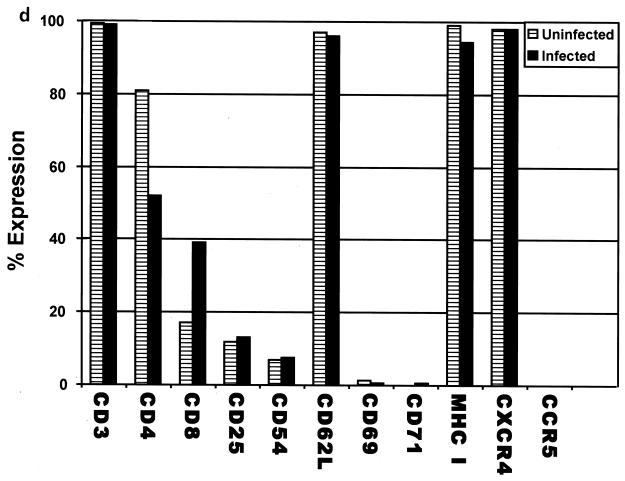
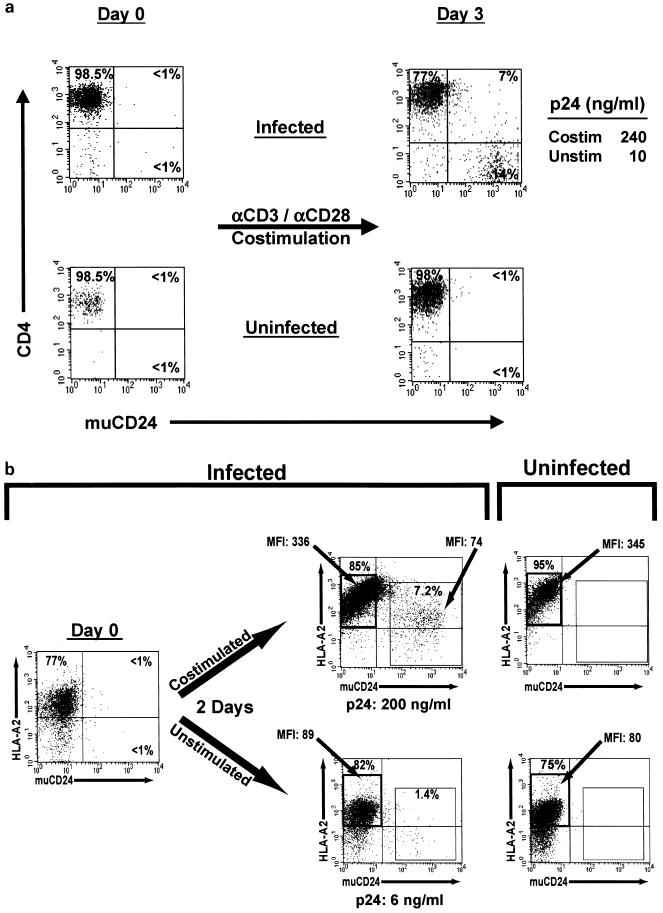
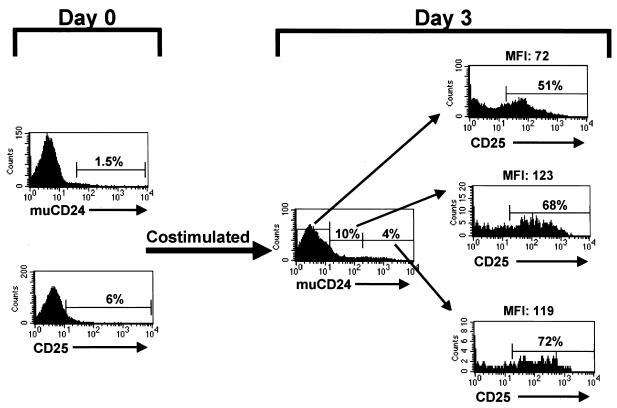
Highly active antiretroviral therapy has succeeded in many cases in suppressing virus production in patients infected with human immunodeficiency virus (HIV); however, once treatment is discontinued, virus replication is rekindled. One reservoir capable of harboring HIV in a latent state and igniting renewed infection once therapy is terminated is a resting T cell. Due to the sparsity of T cells latently infected with HIV in vivo, it has been difficult to study viral and cellular interactions during latency. The SCID-hu (Thy/Liv) mouse model of HIV latency, however, provides high percentages of latently infected cells, allowing a detailed analysis of phenotype. Herein we show that latently infected cells appear phenotypically normal. Following cellular stimulation, the virus completes its life cycle and induces phenotypic changes, such as CD4 and major histocompatibility complex class I down-regulation, in the infected cell. In addition, HIV expression following activation did not correlate with expression of the cellular activation marker CD25. The apparently normal phenotype and lack of HIV expression in latently infected cells could prevent recognition by the immune response and contribute to the long-lived nature of this reservoir.


Figures

FIG. 1.
FIG. 1.
Phenotype of SCID-hu thymocytes and peripheral blood lymphocytes (PBL). Thymocytes and peripheral blood lymphocytes from uninfected and HIVNL-r-HSAs-infected SCID-hu (Thy/Liv) mice were harvested 5 weeks postinfection and were stained with monoclonal antibodies to CD45, CD4, and CD8 on the day of biopsy. CD45+ (human) cells were gated and analyzed for CD4 and CD8 expression. Human thymocytes and lymphocytes from two experiments (tissue donors 67 and 30, respectively) are shown.
FIG. 2.
FIG. 2.
Flow cytometry analysis of cells harboring latent HIV. (a) Presence of latent HIV in CD4 SP thymocytes. At 5 weeks postinfection with HIVNL-r-HSAs Thy/Liv implants (tissue donor 67) were pooled and cultured in medium containing a viral protease inhibitor and AZT (same experiment as Fig. 1a, experiment 1). CD4 SP, muCD24-negative thymocytes (day 0) were then isolated by panning. The left panels were gated on CD45+ cells to exclude any murine cell contamination and show that less then 1% of the isolated thymocytes expressed CD8 or muCD24. These thymocytes were either left unstimulated or costimulated for 3 days, and HIV (muCD24) expression was quantitated by flow cytometry. The right panels show day 3 expression of HIV as a result of each condition. HIV (muCD24) expression is illustrated based on size and granularity following costimulation (upper panels). Quadrants are set according to isotype controls for each condition. (b) Phenotype of infected thymocytes. Uninfected and HIVNL-r-HSAs-infected CD4 SP, muCD24-negative thymocytes (from Fig. 2a, day 0) were stained for the indicated proteins on day 0 and analyzed by flow cytometry. Following activation approximately 10% of these cells showed evidence of latent infection (Fig. 2a). The y axis indicates the percentage of cells expressing each protein. Similar results were observed in multiple experiments. (c) MHC-I expression on thymocytes and peripheral blood lymphocytes (PBL) in response to HIV infection. CD4 SP, muCD24-negative, CD45-positive thymocytes and total-CD45-positive peripheral lymphocytes from uninfected and HIVNL-r-HSAs-infected mice (tissue donor 75) were stained on day 0 for MHC-I (HLA-ABC) expression and were analyzed by flow cytometry. The gate indicates MHC-I-positive cells and is based on an isotype control. The mean fluorescence intensity (MFI) of MHC-I-positive cells is shown above each gate. Similar results were observed in multiple experiments. (d) Phenotype of human peripheral blood lymphocytes. Peripheral blood lymphocytes from uninfected and HIVNL-r-HSAs-infected mice (tissue donor 67) were stained on day 0 with an antibody to the indicated human protein and CD45. CD45-positive (human) lymphocytes were analyzed by flow cytometry for the percentage of cells expressing each protein (shown as y axis). These results were consistent over multiple experiments.
FIG. 2.
FIG. 2.
Flow cytometry analysis of cells harboring latent HIV. (a) Presence of latent HIV in CD4 SP thymocytes. At 5 weeks postinfection with HIVNL-r-HSAs Thy/Liv implants (tissue donor 67) were pooled and cultured in medium containing a viral protease inhibitor and AZT (same experiment as Fig. 1a, experiment 1). CD4 SP, muCD24-negative thymocytes (day 0) were then isolated by panning. The left panels were gated on CD45+ cells to exclude any murine cell contamination and show that less then 1% of the isolated thymocytes expressed CD8 or muCD24. These thymocytes were either left unstimulated or costimulated for 3 days, and HIV (muCD24) expression was quantitated by flow cytometry. The right panels show day 3 expression of HIV as a result of each condition. HIV (muCD24) expression is illustrated based on size and granularity following costimulation (upper panels). Quadrants are set according to isotype controls for each condition. (b) Phenotype of infected thymocytes. Uninfected and HIVNL-r-HSAs-infected CD4 SP, muCD24-negative thymocytes (from Fig. 2a, day 0) were stained for the indicated proteins on day 0 and analyzed by flow cytometry. Following activation approximately 10% of these cells showed evidence of latent infection (Fig. 2a). The y axis indicates the percentage of cells expressing each protein. Similar results were observed in multiple experiments. (c) MHC-I expression on thymocytes and peripheral blood lymphocytes (PBL) in response to HIV infection. CD4 SP, muCD24-negative, CD45-positive thymocytes and total-CD45-positive peripheral lymphocytes from uninfected and HIVNL-r-HSAs-infected mice (tissue donor 75) were stained on day 0 for MHC-I (HLA-ABC) expression and were analyzed by flow cytometry. The gate indicates MHC-I-positive cells and is based on an isotype control. The mean fluorescence intensity (MFI) of MHC-I-positive cells is shown above each gate. Similar results were observed in multiple experiments. (d) Phenotype of human peripheral blood lymphocytes. Peripheral blood lymphocytes from uninfected and HIVNL-r-HSAs-infected mice (tissue donor 67) were stained on day 0 with an antibody to the indicated human protein and CD45. CD45-positive (human) lymphocytes were analyzed by flow cytometry for the percentage of cells expressing each protein (shown as y axis). These results were consistent over multiple experiments.
FIG. 3.
FIG. 3.
HIV reactivation from latency causes CD4 and MHC-I down-regulation on infected cells. (a) CD4 down-regulation. Thymocytes from a single Thy/Liv implant (tissue donor 187) were stained with monoclonal antibodies to CD4, CD8, CD45, and muCD24 and were then isolated by fluorescence-activated cell sorting at 5 weeks postinfection with HIVNL-r-HSAs (day 0, top). Uninfected thymocytes from the same tissue donor were sorted in parallel (day 0, bottom). Thymocytes were cultured in the presence of protease inhibitor and AZT. The left panels were gated on CD45-positive cells and indicate that more than 98% of the sorted cells were CD4 SP and muCD24 negative postsort. Less than 1% of these thymocytes expressed CD8 (data not shown). Thymocytes were then costimulated for 3 days and were analyzed for CD4 and muCD24 expression by flow cytometry. The right panels are gated on CD45-postive cells and show HIV (muCD24) and CD4 expression following costimulation (Costim). Unstim, unstimulated. The level of p24 expression from costimulated and unstimulated cultures is shown at the right of the figure. (b) MHC-I down-regulation. CD4 SP thymocytes from HIVNL-r-HSAs-infected implants (tissue donor 62) were negatively selected as done for Fig. 2a. Isolated cells contained less than 2% CD8-positive and less than 1% muCD24-expressing cells (day 0). Isolated thymocytes were cultured either unstimulated or costimulated for 2 days in the presence of a viral protease inhibitor and AZT and were analyzed for HLA-A2 and HIV (muCD24) expression by flow cytometry. The mean fluorescence intensity (MFI) of HLA-A2 expression from muCD24-positive and -negative cells on day 2 is shown. Uninfected thymocytes isolated and cultured in the same manner for 2 days are shown in the right panels for comparison. The level of p24 expression for each condition is shown below each dot plot.
FIG. 4.
FIG. 4.
CD25 expression on thymocytes before and after HIV reactivation from latency. Thymocytes from pooled HIVNL-r-HSAs-infected Thy/Liv implants were negatively selected as done for Fig. 2a and were analyzed for CD45, CD25, and muCD24 expression by flow cytometry (day 0). Thymocytes were then costimulated for 3 days in the presence of a viral protease inhibitor, and the percentage of CD45-positive thymocytes expressing muCD24 was assessed by flow cytometry (day 3, left panel). Backgating on muCD24-negative (top right), muCD24-dim-positive (middle right), and muCD24-bright-positive (bottom right) thymocytes illustrated the percentage of cells expressing CD25 in each population. The mean fluorescence intensity (MFI) of CD25 expression for each panel is indicated above each histogram.

Similar articles

Cited by

References

    1. Aiken, C., J. Konner, N. R. Landau, M. E. Lenburg, and D. Trono. 1994. Nef induces CD4 endocytosis: requirement for a critical dileucine motif in the membrane-proximal CD4 cytoplasmic domain. Cell 76:853-864. - PubMed
    1. Aldrovandi, G. M., G. Feuer, L. Gao, B. Jamieson, M. Kristeva, I. S. Chen, and J. A. Zack. 1993. The SCID-hu mouse as a model for HIV-1 infection. Nature 363:732-736. - PubMed
    1. Blaak, H., A. B. van't Wout, M. Brouwer, B. Hooibrink, E. Hovenkamp, and H. Schuitemaker. 2000. In vivo HIV-1 infection of CD45RA(+)CD4(+) T cells is established primarily by syncytium-inducing variants and correlates with the rate of CD4(+) T cell decline. Proc. Natl. Acad. Sci. USA 97:1269-1274. - PMC - PubMed
    1. Borvak, J., C. S. Chou, K. Bell, G. Van Dyke, H. Zola, O. Ramilo, and E. S. Vitetta. 1995. Expression of CD25 defines peripheral blood mononuclear cells with productive versus latent HIV infection. J. Immunol. 155:3196-3204. - PubMed
    1. Brooks, D. G., S. G. Kitchen, C. M. Kitchen, D. D. Scripture-Adams, and J. A. Zack. 2001. Generation of HIV latency during thymopoiesis. Nat. Med. 7:459-464. - PubMed

Publication types

MeSH terms

Substances