. 2002 Jan 21;195(2):245-57.
doi: 10.1084/jem.20011022.

Expression of interleukin (IL)-18 and functional IL-18 receptor on human vascular endothelial cells, smooth muscle cells, and macrophages: implications for atherogenesis

Affiliations

Expression of interleukin (IL)-18 and functional IL-18 receptor on human vascular endothelial cells, smooth muscle cells, and macrophages: implications for atherogenesis

Norbert Gerdes et al. J Exp Med. .

Abstract

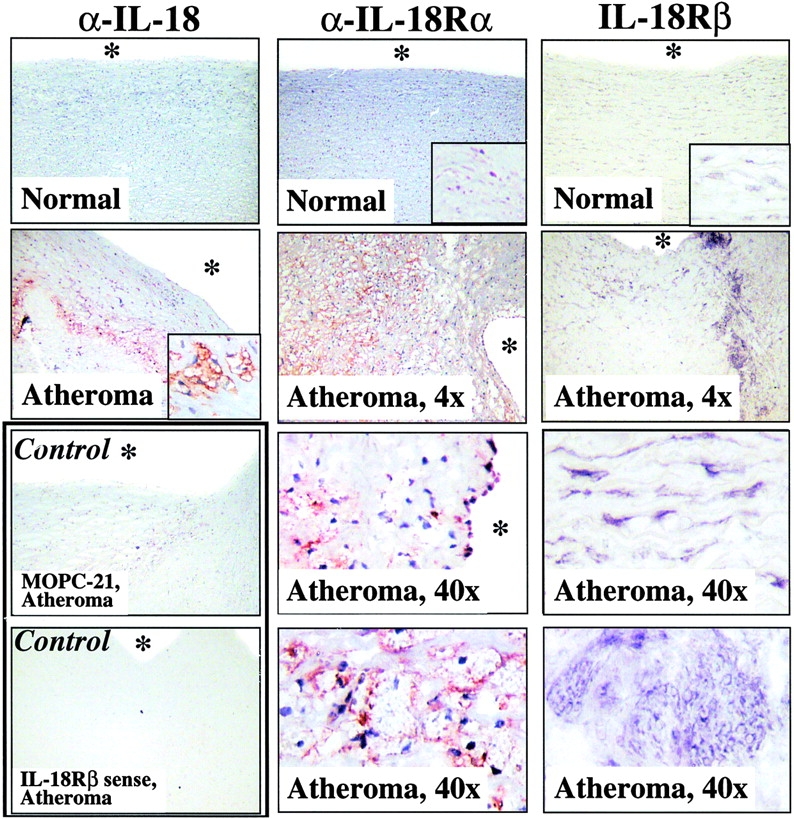
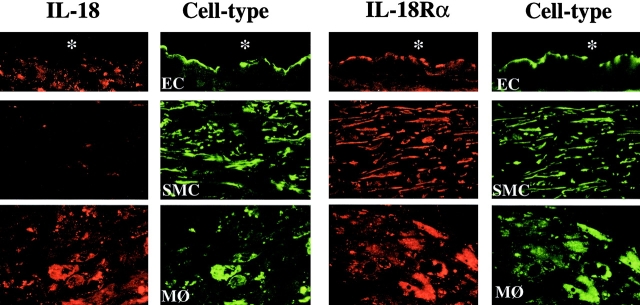
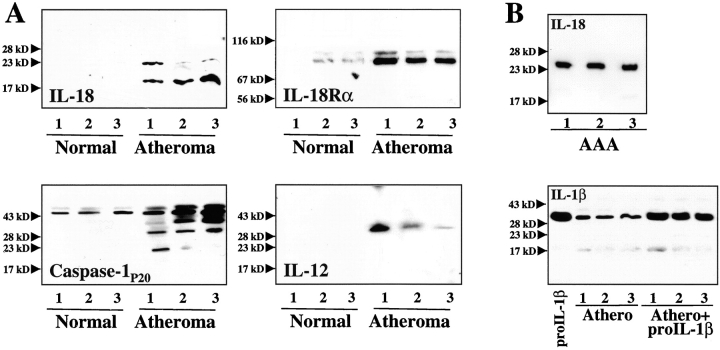
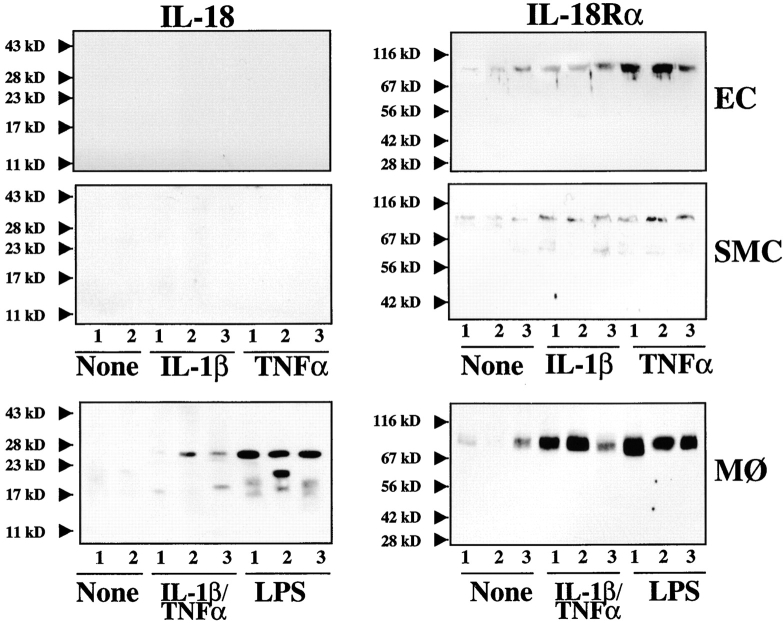
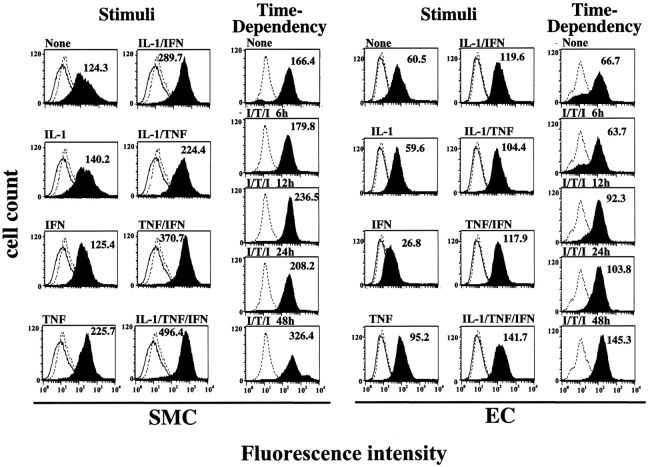
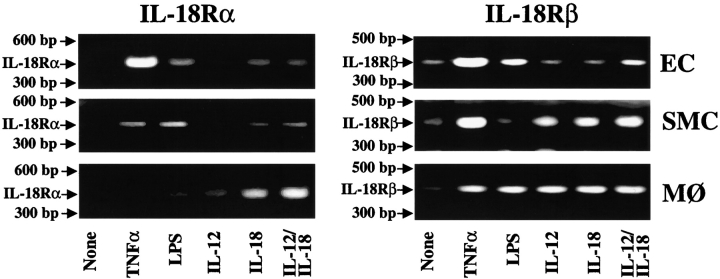
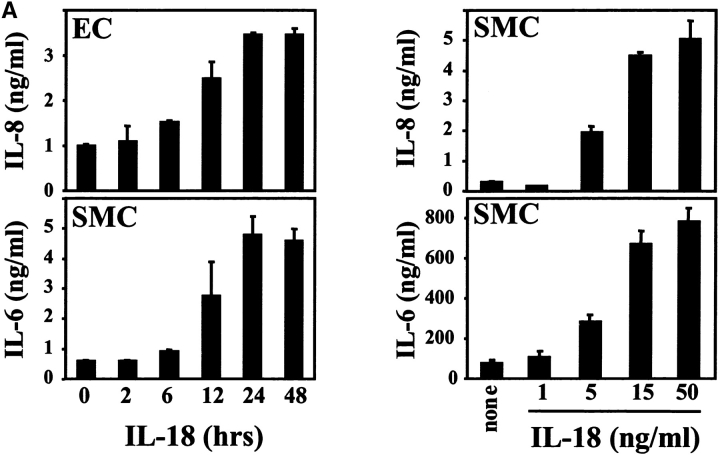
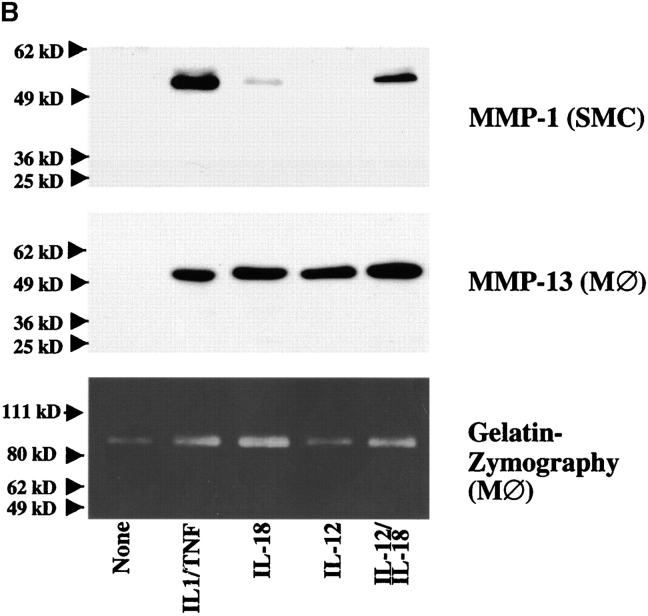
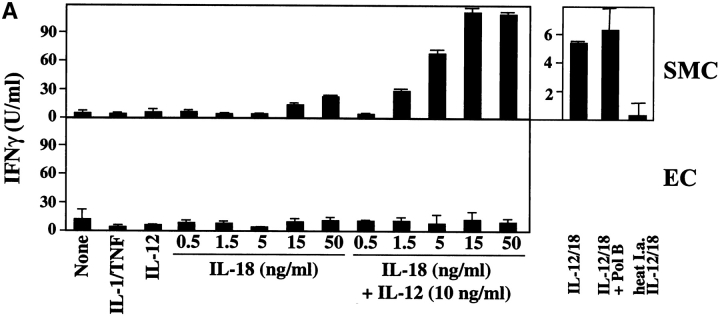
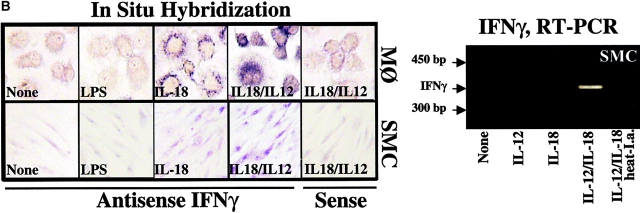
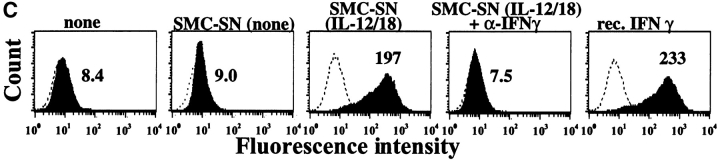
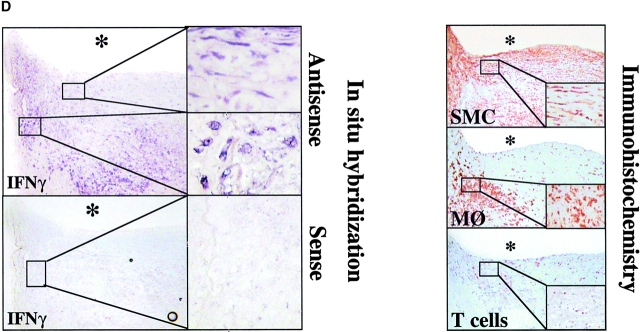
Although considerable evidence implicates the cytokine interferon (IFN)-gamma in atherogenesis, the proximal inducers and the range of sources of its expression remain unknown. This study tested the hypothesis that interleukin (IL)-18 regulates IFN-gamma expression during atherogenesis. Indeed, human atheroma in situ expressed IL-18 and elevated levels of its receptor subunits, IL-18Ralpha/beta, compared with nondiseased arterial tissue. IL-18 occurred predominantly as the mature, 18-kD form and colocalized with mononuclear phagocytes (MPhi), while endothelial cells (ECs), smooth muscle cells (SMCs), and MPhi all expressed IL-18Ralpha/beta. Correspondingly in vitro, only MPhi expressed IL-18, while all three cell types displayed the IL-18Ralpha/beta complex constitutively, exhibiting enhanced expression upon stimulation with LPS, IL-1beta, or tumor necrosis factor (TNF)-alpha. IL-18 signaling evoked effectors involved in atherogenesis, e.g., cytokines (IL-6), chemokines (IL-8), intracellular adhesion molecules (ICAM)-1, and matrix metalloproteinases (MMP-1/-9/-13), demonstrating functionality of the receptor on ECs, SMCs, and MPhi. Finally, IL-18, particularly in combination with IL-12, induced the expression of IFN-gamma in cultured MPhi and, surprisingly, in SMCs (but not in ECs). The expression of functional IL-18 and IL-18 receptor on human atheroma-associated ECs, SMCs, and MPhi, and its unexpected ability to induce IFN-gamma expression in SMCs, suggests a novel paracrine proinflammatory pathway operating during atherogenesis.


Figures

Figure 1.
Figure 1.
Human atherosclerotic lesions express IL-18, IL-18Rα, and IL-18Rβ. Serial cryostat sections of frozen specimens of nonatherosclerotic aorta (Normal) and carotid atheroma (Atheroma) were analyzed by either immunohistochemistry, using mouse anti–human IL-18 (top panels) or goat anti–human IL-18Rα antibodies (middle column), or by in situ hybridization, using IL-18Rβ antisense oligomers (right column). The corresponding lower panels as well as insets depict higher magnifications (40×) of the overviews (4×) presented in the top panels. Control experiments (bottom panels) demonstrated that application of MOPC-21, goat IgG (data not shown), or IL-18Rβ sense oligomers did not yield specific staining in atherosclerotic specimens. The asterisks indicate the lumen of the vessels. Analysis of tissue obtained from two other nonatherosclerotic as well as atherosclerotic specimens showed similar results.
Figure 2.
Figure 2.
Differential expression of IL-18 and IL-18Rα in ECs, SMCs, and MØ in human atherosclerotic lesions. Double-immunofluorescence staining colocalized IL-18 (red, left) or IL-18Rα (red, right) with ECs (anti-CD31), SMCs (anti-α-actin), or MØ (anti-CD68) within atherosclerotic plaques. Analysis of three atheroma from different individuals showed similar results.
Figure 3.
Figure 3.
Human atherosclerotic lesions contain immunoreactive IL-18 and IL-18Rα. (A) Extracts (50 μg/lane) of nonatherosclerotic arterial specimens (Normal) as well as atherosclerotic lesions (Atheroma) were applied to SDS-PAGE and subsequent Western blot analysis using either an anti–IL-18, anti–IL-18Rα, anti–caspase-1P20, or anti–IL-12P40 antibody. (B) As control for protein degradation, (top) protein extracts of abdominal aortic aneurysm (AAA) were applied to Western blot analysis for IL-18 or (bottom) exogenous recombinant IL-1β precursor (300 ng/mg tissue) was added to extracts of atherosclerotic tissue. The positions of the molecular weight markers are indicated on the left. Analysis of tissue obtained from a total of five nonatherosclerotic as well as seven atherosclerotic specimens showed similar results.
Figure 4.
Figure 4.
Differential expression of IL-18 and IL-18Rα on cultured ECs, SMCs, and MØ in vitro. Supernatants (50 μl/lane; for IL-18) or lysates (50 μg total protein/lane; for IL-18Rα) of ECs, SMCs, or MØ cultures, incubated for 24 h with serum-free medium alone (None) or human recombinant IL-1β (10 ng/ml), TNF-α (50 ng/ml), combinations thereof, or LPS (100 ng/ml) were analyzed by Western blotting using anti–human IL-18 (left) or IL-18Rα (right) antibody. The positions of the molecular weight markers are indicated on the left. Three independent experiments yielded similar data.
Figure 5.
Figure 5.
Proinflammatory cytokines induce the cell surface expression of IL-18Rα in human ECs and SMCs. Human vascular SMCs and ECs were incubated 36 h (stimuli) or for the respective times (time dependency) with either medium alone (None) or medium supplemented with IL-1β (10 ng/ml), IFN-γ (1,000 U/ml), TNF-α (50 ng/ml), or combinations thereof, and were studied for the expression of IL-18Rα by FACS® analysis. Staining for IL-18Rα (solid histograms) is compared with the isotype control (dotted line) and unstained control (solid line). At least 20,000 viable cells were analyzed for each staining. Values of geometric mean fluorescence are indicated in each panel. Similar results were obtained in three independent experiments using cells of different donors.
Figure 6.
Figure 6.
Proinflammatory cytokines induce the expression of IL-18Rα and IL-18Rβ transcripts in human ECs, SMCs, and MØ. Expression of IL-18Rα and IL-18Rβ transcripts was analyzed by RT-PCR using RNA obtained from ECs, SMCs, and MØ cultured in medium alone (None), or medium supplemented with TNF-α (50 ng/ml), endotoxin (100 ng/ml LPS), 50 μg/ml IL-12, 10 μg/ml IL-18, or a combination of the latter two. PCR products were applied to 1.5% agarose gels. Positions of the base pair markers are indicated on the left. Comparable data were obtained using cells from at least three different donors.
Figure 7.
Figure 7.
Expression of functional IL-18 receptor on cultured human ECs, SMCs, and MØ. (A) Cultures of ECs or SMCs were stimulated with recombinant human IL-18 (50 ng/ml) for the respective times (left) or with the respective concentrations of IL-18 for 24 h (right). Culture supernatants were analyzed by ELISA for IL-6 or IL-8. Data represent mean ± SD. Similar results were obtained in three independent experiments. (B) Culture supernatants of SMCs or MØ stimulated with IL-1β/TNF-α (10/50 ng/ml), IL-18 (50 ng/ml), IL-12 (10 ng/ml), or a combination of the latter two, were applied to Western blot analysis for MMP-1 or MMP-13, or to gelatin-zymography. Positions of the molecular weight markers are indicated on the left. Comparable data were obtained using cells from at least three different donors.
Figure 7.
Figure 7.
Expression of functional IL-18 receptor on cultured human ECs, SMCs, and MØ. (A) Cultures of ECs or SMCs were stimulated with recombinant human IL-18 (50 ng/ml) for the respective times (left) or with the respective concentrations of IL-18 for 24 h (right). Culture supernatants were analyzed by ELISA for IL-6 or IL-8. Data represent mean ± SD. Similar results were obtained in three independent experiments. (B) Culture supernatants of SMCs or MØ stimulated with IL-1β/TNF-α (10/50 ng/ml), IL-18 (50 ng/ml), IL-12 (10 ng/ml), or a combination of the latter two, were applied to Western blot analysis for MMP-1 or MMP-13, or to gelatin-zymography. Positions of the molecular weight markers are indicated on the left. Comparable data were obtained using cells from at least three different donors.
Figure 8.
Figure 8.
IL-18 induces expression of IFN-γ on vascular SMCs and MØ. (A) Cultures of SMCs or ECs were stimulated (36 h) with either IL-1β/TNF-α (10/50 ng/ml), IL-12 (10 ng/ml), respective concentrations of IL-18, or combinations of the latter two, and supernatants were analyzed by ELISA for IFN-γ. Polymyxin B and heat treated IL-12/IL-18 (95°C for 10 min) were applied to exclude activation via endotoxin contamination. Data represent mean ± SD. Similar results were obtained in at least three independent experiments. (B, right) Total RNA obtained from cultured SMCs stimulated with medium alone (None), IL-12, IL-18, or combinations thereof, was analyzed by RT-PCR for IFN-γ transcripts. (B, left) MØ or SMCs cultured to confluence on 4-well chamber slides were analyzed for the expression of IFN-γ transcripts by in situ hybridization using the respective antisense or sense oligomers. (C) Supernatants of SMC cultures stimulated with medium alone (SMC-SN, none) or combination of IL-12 (10 ng/ml) and IL-18 (50 ng/ml) (SMC-SN (IL-12/18)) were applied in absence or presence of neutralizing α-IFN-γ antibody (SMC-SN (IL-12/18) + α-IFN-γ) to confluent EC cultures for 48 h and MHC II expression was compared with unstimulated (none) or IFN-γ–stimulated (rIFN-γ, 1,000 U/ml) ECs by FACS® analysis. Staining (solid histograms) was compared with isotype control (dotted line). At least 20,000 viable cells were analyzed for each staining. Values of geometric mean fluorescence are indicated in each panel. Similar results were obtained in three independent experiments using cells of different individuals. (D, left) Serial cryostat sections of frozen specimens of carotid atheroma were analyzed for the expression of IFN-γ transcripts by in situ hybridization using the respective antisense (top) or sense (bottom) oligomers. Low (original magnification: 4×, left) and high (original magnification: 40×, right) magnifications are shown. The asterisks indicate the lumen of the vessels. (D, right) Adjacent sections were stained for SMCs (anti–α-actin), MØ (anti-CD68), or T lymphocytes (anti-CD3). Low (4×) and high (40×, insets) magnifications are shown.
Figure 8.
Figure 8.
IL-18 induces expression of IFN-γ on vascular SMCs and MØ. (A) Cultures of SMCs or ECs were stimulated (36 h) with either IL-1β/TNF-α (10/50 ng/ml), IL-12 (10 ng/ml), respective concentrations of IL-18, or combinations of the latter two, and supernatants were analyzed by ELISA for IFN-γ. Polymyxin B and heat treated IL-12/IL-18 (95°C for 10 min) were applied to exclude activation via endotoxin contamination. Data represent mean ± SD. Similar results were obtained in at least three independent experiments. (B, right) Total RNA obtained from cultured SMCs stimulated with medium alone (None), IL-12, IL-18, or combinations thereof, was analyzed by RT-PCR for IFN-γ transcripts. (B, left) MØ or SMCs cultured to confluence on 4-well chamber slides were analyzed for the expression of IFN-γ transcripts by in situ hybridization using the respective antisense or sense oligomers. (C) Supernatants of SMC cultures stimulated with medium alone (SMC-SN, none) or combination of IL-12 (10 ng/ml) and IL-18 (50 ng/ml) (SMC-SN (IL-12/18)) were applied in absence or presence of neutralizing α-IFN-γ antibody (SMC-SN (IL-12/18) + α-IFN-γ) to confluent EC cultures for 48 h and MHC II expression was compared with unstimulated (none) or IFN-γ–stimulated (rIFN-γ, 1,000 U/ml) ECs by FACS® analysis. Staining (solid histograms) was compared with isotype control (dotted line). At least 20,000 viable cells were analyzed for each staining. Values of geometric mean fluorescence are indicated in each panel. Similar results were obtained in three independent experiments using cells of different individuals. (D, left) Serial cryostat sections of frozen specimens of carotid atheroma were analyzed for the expression of IFN-γ transcripts by in situ hybridization using the respective antisense (top) or sense (bottom) oligomers. Low (original magnification: 4×, left) and high (original magnification: 40×, right) magnifications are shown. The asterisks indicate the lumen of the vessels. (D, right) Adjacent sections were stained for SMCs (anti–α-actin), MØ (anti-CD68), or T lymphocytes (anti-CD3). Low (4×) and high (40×, insets) magnifications are shown.

References

    1. Libby, P. 1990. Inflammatory and immune mechanisms in atherogenesis. Atherosclerosis Reviews. A. Leaf and P. Weber, editors. Raven Press, New York. 79–89.
    1. Ross, R. 1999. Atherosclerosis-an inflammatory disease. N. Engl. J. Med. 340:115–126. - PubMed
    1. Frostegard, J., A.K. Ulfgren, P. Nyberg, U. Hedin, J. Swedenborg, U. Andersson, and G.K. Hansson. 1999. Cytokine expression in advanced human atherosclerotic plaques: dominance of pro-inflammatory (Th1) and macrophage-stimulating cytokines. Atherosclerosis. 145:33–43. - PubMed
    1. Gupta, S., A.M. Pablo, X. Jiang, N. Wang, A.R. Tall, and C. Schindler. 1997. IFN-γ potentiates atherosclerosis in ApoE knock-out mice. J. Clin. Invest. 99:2752–2761. - PMC - PubMed
    1. Nagano, H., R.N. Mitchell, M.K. Taylor, S. Hasegawa, N.L. Tilney, and P. Libby. 1997. Interferon-γ deficiency prevents coronary arteriosclerosis but not myocardial rejection in transplanted mouse hearts. J. Clin. Invest. 100:550–557. - PMC - PubMed

Publication types

MeSH terms