. 2002 Jan 22;99(2):637-42.
doi: 10.1073/pnas.022637199.

mda-5: An interferon-inducible putative RNA helicase with double-stranded RNA-dependent ATPase activity and melanoma growth-suppressive properties

Affiliations

mda-5: An interferon-inducible putative RNA helicase with double-stranded RNA-dependent ATPase activity and melanoma growth-suppressive properties

Dong-chul Kang et al. Proc Natl Acad Sci U S A. .

Abstract

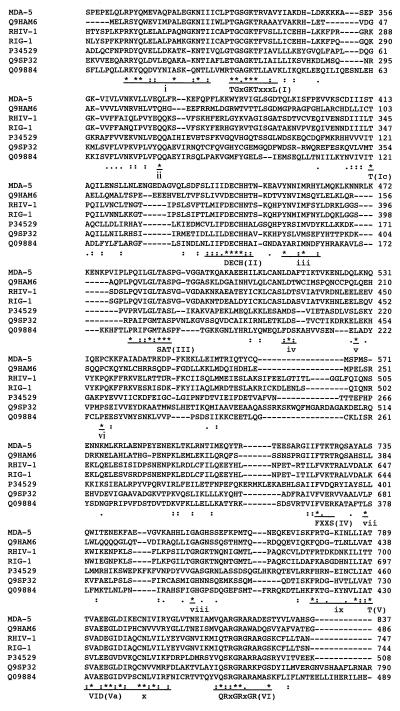
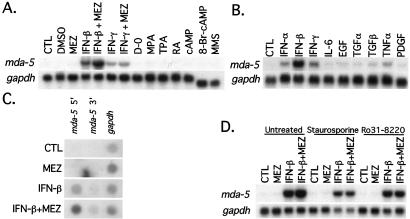
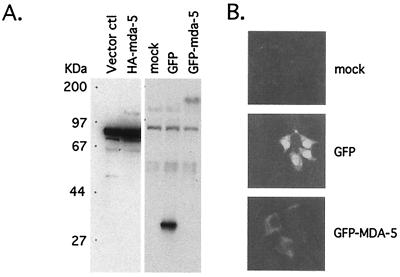
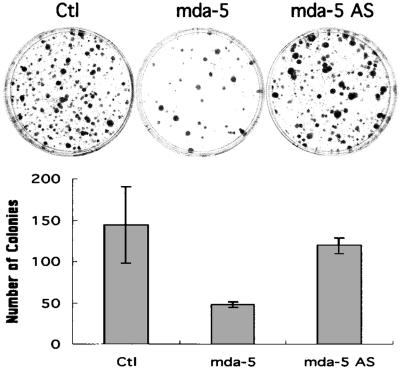
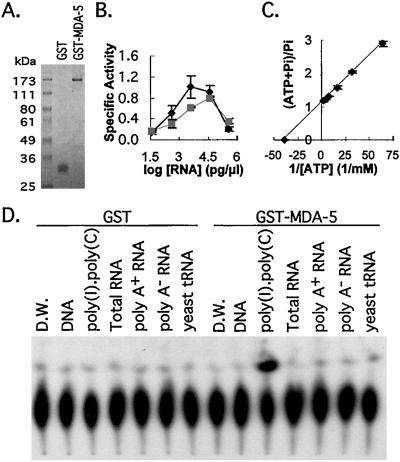
Human melanoma cells can be reprogrammed to terminally differentiate and irreversibly lose proliferative capacity by appropriate pharmacological manipulation. Subtraction hybridization identified melanoma differentiation-associated gene-5 (mda-5) as a gene induced during differentiation, cancer reversion, and programmed cell death (apoptosis). This gene contains both a caspase recruitment domain and putative DExH group RNA helicase domains. Atypical helicase motifs of MDA-5 deviate from consensus sequences but are well conserved in a potentially new group of cloned and hypothetical proteins. mda-5 is an early response gene inducible by IFN and tumor necrosis factor-alpha, responding predominantly to IFN-beta. Protein kinase C activation by mezerein further augments mda-5 expression induced by IFN-beta. Expression of mda-5 is controlled transcriptionally by IFN-beta, and the MDA-5 protein localizes in the cytoplasm. mda-5 displays RNA-dependent ATPase activity, and ectopic expression of mda-5 in human melanoma cells inhibits colony formation. In these contexts, mda-5 may function as a mediator of IFN-induced growth inhibition and/or apoptosis. MDA-5 is a double-stranded RNA-dependent ATPase that contains both a caspase recruitment domain and RNA helicase motifs, with a confirmed association with growth and differentiation in human melanoma cells.


Figures

Figure 1
Figure 1
Sequence alignment of putative RNA helicases. CLUSTALW alignment of helicase domains of putative RNA helicases that share the RNA helicase motifs with mda-5. Conserved residues in DExH group RNA helicase defined in Jankowsky and Jankowsky (14) are aligned with consensus sequence (uppercase Roman numeric). Those underlined and marked with lowercase Roman numeric are for conserved motifs in this subgroup. Asterisks (*), identical residues; colons (:), conserved substitutions; dots (.), semiconserved substitutions.
Figure 2
Figure 2
Expression of mda-5. Northern blot analyses of mda-5 after treatment with melanoma differentiation reagents (A) and growth factors (B) are shown. HO-1 cells were treated with the indicated reagents for 24 h. The concentrations in A are: control (CTL); 0.1% DMSO; 10 ng/ml MEZ; 2,000 units/ml IFN-β; 2,000 units/ml IFN-β + 10 ng/ml MEZ; 100 units/ml IFN-γ; 100 units/ml IFN-γ + 10 ng/ml MEZ; serum-free medium (D-O); 2.5 μM all-trans retinoic acid: 3 μM mycophenolic acid (MPA); 16 nM 12-O-tetradecanoylphorbol-13-acetate (TPA); 1 mM 3′-5′ cAMP; 1 mM 8-bromo-3′-5′ cyclic adenosine monophosphate (8-Br-cAMP); and 10 ng/ml methyl methanesulfonate (MMS). The reagents in B are: CTL, control; 1,000 units/ml IFN-α; 1,000 units/ml IFN-β; 1,000 units/ml IFN-γ; 1 ng/ml IL-6; 10 ng/ml epidermal growth factor (EGF); 10 ng/ml transforming growth factor-α (TGF-α); 2.5 ng/ml transforming growth factor-β (TGF-β); 1 ng/ml TNF-α; and 10 ng/ml platelet-derived growth factor (PDGF). (C) Nuclear run-on assays for mda-5. Nuclei were prepared from HO-1 melanoma cells treated with the indicated reagent(s) for 4 h. Blots were prepared and hybridized as described in Materials and Methods. gapdh, glyceraldehyde-3-phosphate dehydrogenase.(D) PKC inhibitors on mda-5 expression. RNA samples were extracted from HO-1 melanoma cells pretreated with 50 nM staurosporine or 0.2 μM Ro31-8220 (Calbiochem) for 30 min and treated with the indicated reagents for 8 h. RNA sample preparation and Northern hybridization were performed as described in Materials and Methods.
Figure 3
Figure 3
Protein expression of mda-5 and intracellular localization. (A) Protein expression from mda-5 cDNA after transient transfection. Protein extracts were prepared from 293 cells transiently transfected with the indicated expression vector and resolved in 9% SDS/PAGE. Western blot analysis was performed with specified antibodies. ctl, control. (B) Intracellular localization of mda-5 protein. Transiently transfected 293 cells on cover slips with the indicated fusion protein constructs were mounted and photographed by using fluorescent confocal microscopy (×400).
Figure 4
Figure 4
Effect of ectopic expression of mda-5 on HO-1 cells. Cells were transfected with the indicated expression vector, replated 2 days later, and selected with G418. (Upper) Representative colony-forming assays. G418-resistant colonies transfected with the indicated expression vectors are shown. Ctl, control; AS, antisense. (Lower) Quantitation of the effect of ectopic expression of mda-5 on colony formation. Giemsa-stained G418-resistant colonies containing more than ≈50 cells were counted. The results are the mean ± standard error from three independent transfections (three plates for each transfection) with two different plasmid batches.
Figure 5
Figure 5
ATPase activity of MDA-5. (A) Electrophoretogram of purified proteins. GST and GST-MDA-5 were resolved on 9% SDS/PAGE and stained with Coomassie brilliant blue. (B) Effect of divalent metal ions and RNA concentration on MDA-5 ATPase activity. ATPase activity assay was performed with variable poly(I)⋅poly(C) concentrations (0.038, 0.375, 3.75, 37.5, and 375 ng/μl). MnCl2 (3 mM, ■) substituted for MgCl2 (3 mM, ♦). The results were quantitated by PhosphorImager. The data shown are the mean ± SD from two experiments. Specific activity is nmol/min/μg of protein. (C) Lineweaver–Burk plot of the effect of [ATP] on MDA-5 ATPase activity. ATPase activity was measured with various ATP concentrations (15.6, 31.3, 62.5, 125, 250, and 500 μM) for 20 min in a 37°C air incubator and quantitated by PhosphorImager. The result shown is the mean ± SD from three independent experiments. (D) Autoradiogram of MDA-5 ATPase assay with various RNA species. The indicated types of RNA (20 ng/μl) were added in standard reaction mixture, and the results presented were obtained by exposing a TLC plate to Kodak X-Omat film. D.W., distilled water.

References

    1. Leszczyniecka M, Robert T, Dent P, Grant S, Fisher P B. Pharmacol Ther. 2001;90:105–156. - PubMed
    1. Waxman S. Differentiation Therapy. Vol. 10. Rome: Ares-Serono Symposia Publishers; 1996. pp. 1–531.
    1. Freemerman A J, Vrana J A, Tombes R M, Jiang H, Chellappan S P, Fisher P B, Grant S. Leukemia. 1997;11:504–513. - PubMed
    1. Jiang H, Lin J, Fisher P B. Mol Cell Differ. 1994;2:221–239.
    1. Wang Z, Su Z Z, Fisher P B, Wang S, VanTuyle G, Grant S. Exp Cell Res. 1998;244:105–116. - PubMed

Publication types

MeSH terms

Associated data