. 2002 Jan 22;99(2):715-20.
doi: 10.1073/pnas.022630199.

Reactive oxygen generated by Nox1 triggers the angiogenic switch

Affiliations

Reactive oxygen generated by Nox1 triggers the angiogenic switch

Jack L Arbiser et al. Proc Natl Acad Sci U S A. .

Abstract

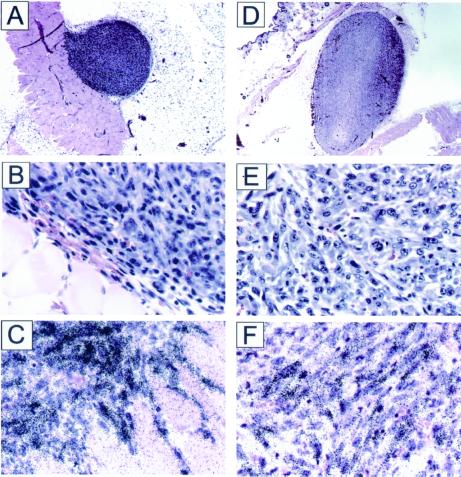
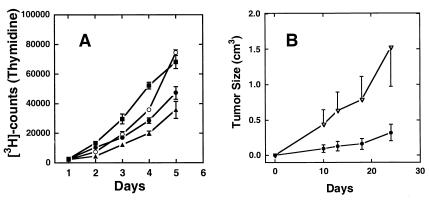
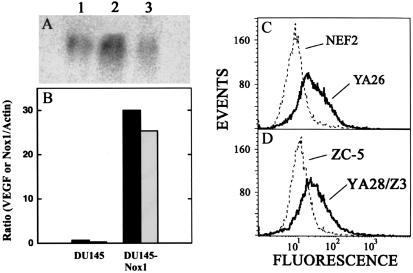
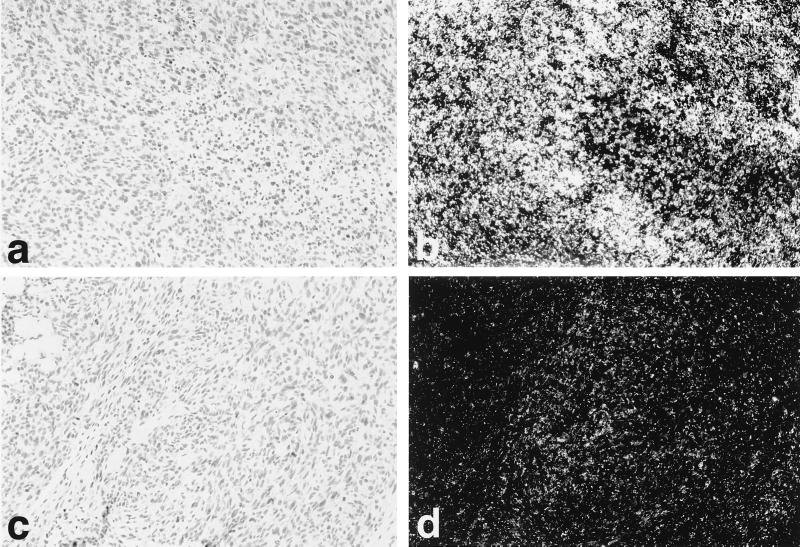
The reactive oxygen-generating enzyme Nox1 transforms NIH 3T3 cells, rendering them highly tumorigenic and, as shown herein, also increases tumorigenicity of DU-145 prostate epithelial cells. Although Nox1 modestly stimulates cell division in both fibroblasts and epithelial cells, an increased mitogenic rate alone did not account fully for the marked tumorigenicity. Herein, we show that Nox1 is a potent trigger of the angiogenic switch, increasing the vascularity of tumors and inducing molecular markers of angiogenesis. Vascular endothelial growth factor (VEGF) mRNA becomes markedly up-regulated by Nox1 both in cultured cells and in tumors, and VEGF receptors (VEGFR1 and VEGFR2) are highly induced in vascular cells in Nox1-expressing tumors. Matrix metalloproteinase activity, another marker of the angiogenic switch, also is induced by Nox1. Nox1 induction of VEGF is eliminated by coexpression of catalase, indicating that hydrogen peroxide signals part of the switch to the angiogenic phenotype.


Figures

Figure 1
Figure 1
Histologic and ISH studies of NEF2 and YA28 tumors. (A and D) Low-power (10×) views of NEF2 and YA28 tumors, respectively. (B and E) Higher-power views of NEF2 and YA28 tumors, respectively. Note the diffuse vascularity as indicated by the presence of red blood cells throughout YA28 in E, but the concentration of vessels at the periphery of NEF2 in B. (C and F) Histone H3 ISH (NEF2 and YA28, respectively).
Figure 2
Figure 2
Prostate cell proliferation and tumor growth are enhanced by Nox1. (A) Thymidine uptake in parental DU-145 human prostate cancer cells (▴) was compared with that in DU-145 cells transfected with empty vector (●) and two separate Nox1-expressing cell lines (Nox3, ○; and Nox6, ■). Points represent the average ± SD of six wells. (B) In each group, six athymic mice were implanted s.c. with 106 vector-control DU-145 cells (●) or Nox1-expressing DU-145 cells (▵). Tumor volumes were determined by bi-dimensional measurement, and average tumor volume was plotted vs. time.
Figure 3
Figure 3
Nox1 induces VEGF expression dependent upon H2O2. (A) Northern blot analysis of Nox1 induction of VEGF mRNA and reversal by catalase. Lane 1, NEF2 (vector-control) cells; lane 2, Nox1-expressing YA28 cells; lane 3, YA28 cells coexpressing catalase (ZC-5 cells; 10 μg of total RNA per lane). (B) Nox1 mRNA (white bars) and VEGF mRNA levels (black bars) were quantified by real-time quantitative PCR in parental DU-145 cells (DU-145) and in Nox1-expressing DU-145 cells (DU-145-Nox1). Data shown are representative of three experiments and are expressed as the ratio to β-actin mRNA. (C) DCF fluorescence was monitored by flow cytometry in vector-control (NEF2) cells and in Nox1-expressing (YA26) cells. (D) As in C, monitoring Nox1-epressing YA26 cells coexpressing catalase (ZC-5) or the same cells transfected with vector alone (YA28/Z3).
Figure 4
Figure 4
Regulation of VEGF expression by Nox1 in vivo. Use of in situ high-level expression of VEGF mRNA is seen in YA28 tumors (a and b), whereas minimal expression of VEGF is seen in NEF2 (control) tumors (c and d). (a and c) Brightfield photomicrographs. (b and d) Darkfield photomicrographs.
Figure 5
Figure 5
Regulation of VEGFR1 and VEGFR2 expression by Nox1 in vivo. ISH reveals high-level expression of flt-1 (VEGFR1) (a and b) and kdr (VEGFR2) (c and d) mRNAs by endothelial cells in blood vessels in YA28 tumors. (a and c) Brightfield photomicrographs. (b and d) Darkfield photomicrographs.
Figure 6
Figure 6
Effect of Nox1 expression on MMP bioactivity. The first group of three lanes represents triplicate samples of conditioned media from NEF2 (vector-control) cells; the second group of three lanes represents conditioned media from Nox1-expressing NIH 3T3 cells (YA28); and the third group of three lanes represents conditioned media from NIH 3T3 cells overexpressing both Nox1 and catalase (ZEO5). The bands at 92 kDa indicate gelatinolysis induced by MMP-9.

References

    1. Suh Y-A, Arnold R S, Lassegue B, Shi J, Xu X, Sorescu D, Chung A B, Griendling K K, Lambeth J D. Nature (London) 1999;401:79–82. - PubMed
    1. Pentland A P, Morrison A R, Jacobs S C, Hruza L L, Hebert J S, Packer L. J Biol Chem. 1992;267:15578–15584. - PubMed
    1. Nakahara H, Kanno T, Inai Y, Utsumi K, Hiramatsu M, Mori A, Packer L. Free Radical Biol Med. 1998;24:85–92. - PubMed
    1. Esposito L A, Melov S, Panov A, Cottrell B A, Wallace D C. Proc Natl Acad Sci USA. 1999;96:4820–4825. - PMC - PubMed
    1. Dang C V, Semenza G L. Trends Biochem Sci. 1999;24:68–72. - PubMed

Publication types

MeSH terms

Substances

LinkOut - more resources