. 2002 Feb 11;443(3):259-74.
doi: 10.1002/cne.10117.

A quantitative morphometric analysis of rat spinal cord remyelination following transplantation of allogenic Schwann cells

Affiliations

A quantitative morphometric analysis of rat spinal cord remyelination following transplantation of allogenic Schwann cells

Karen L Lankford et al. J Comp Neurol. .

Abstract

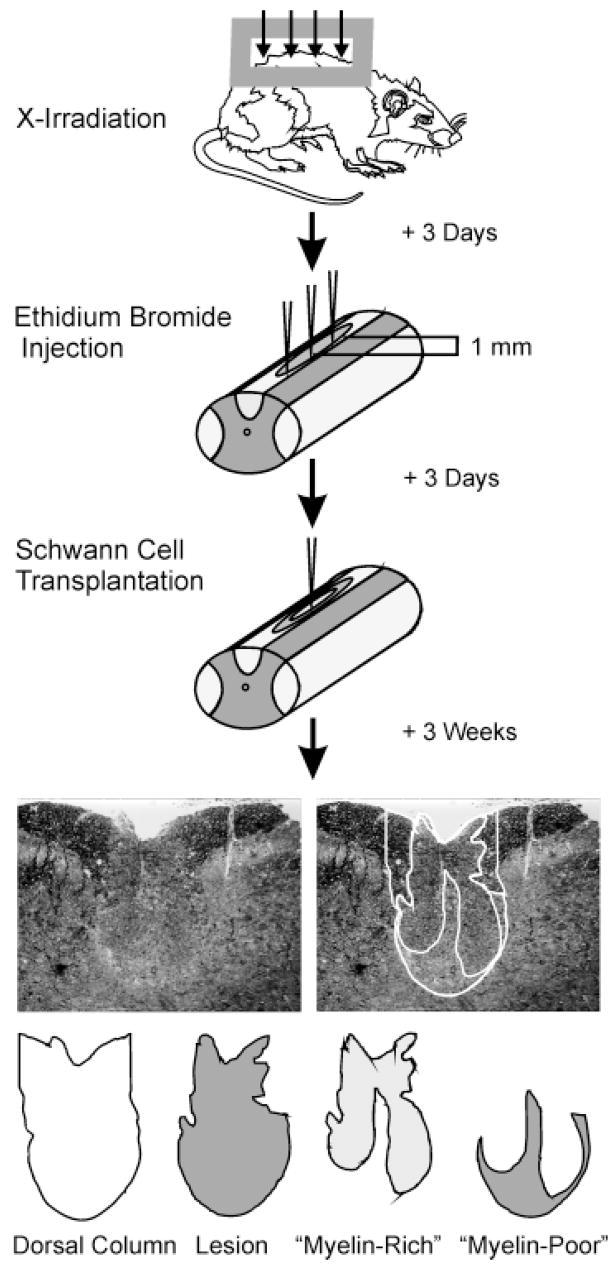
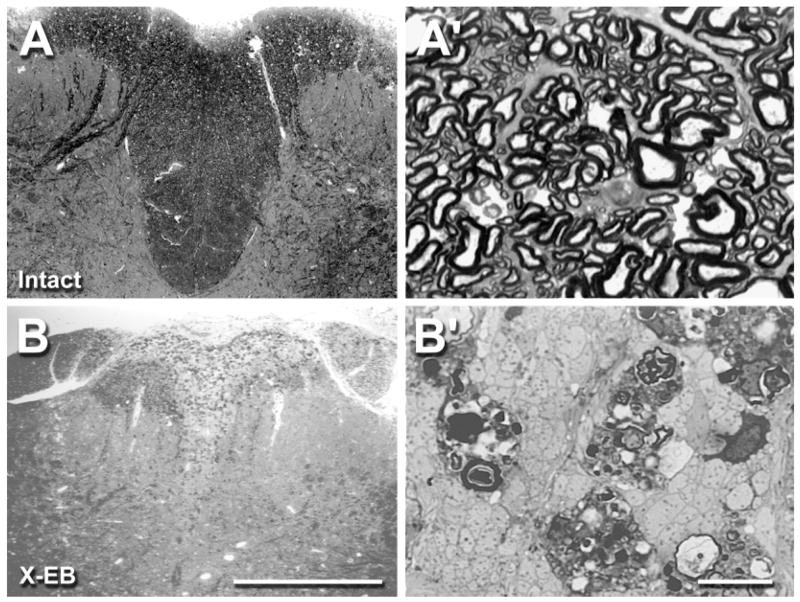
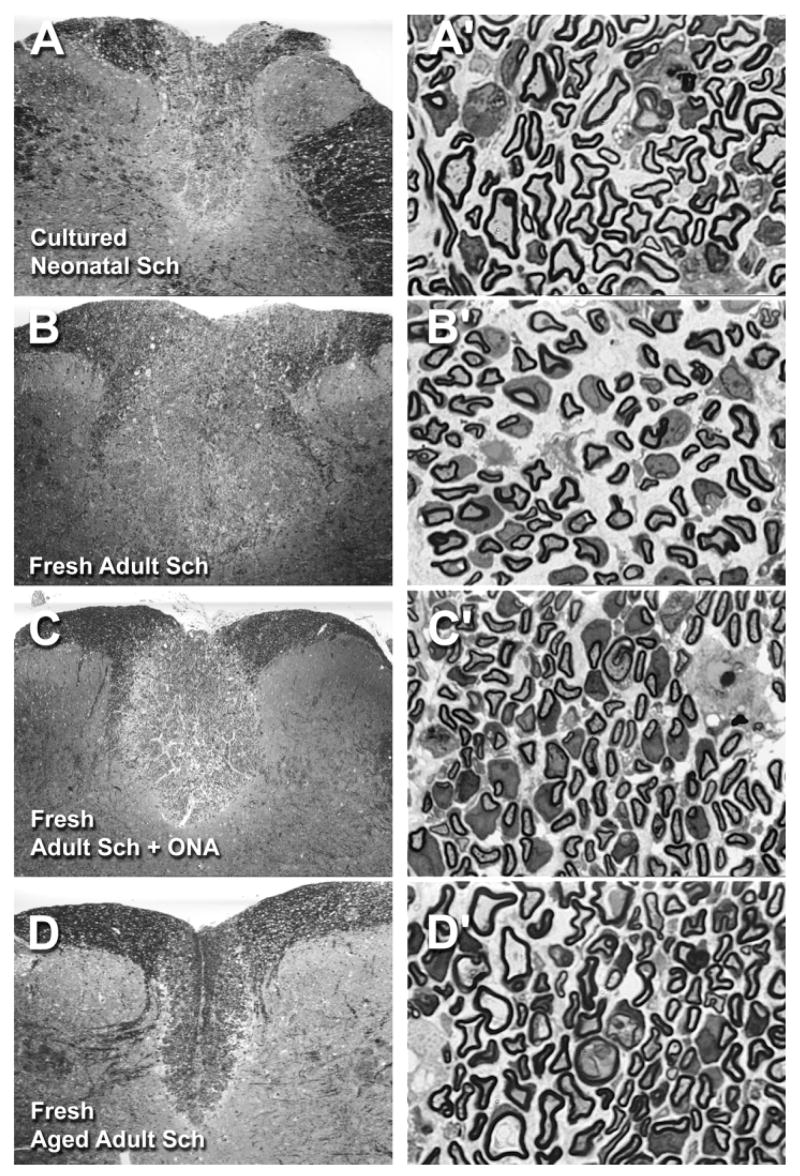
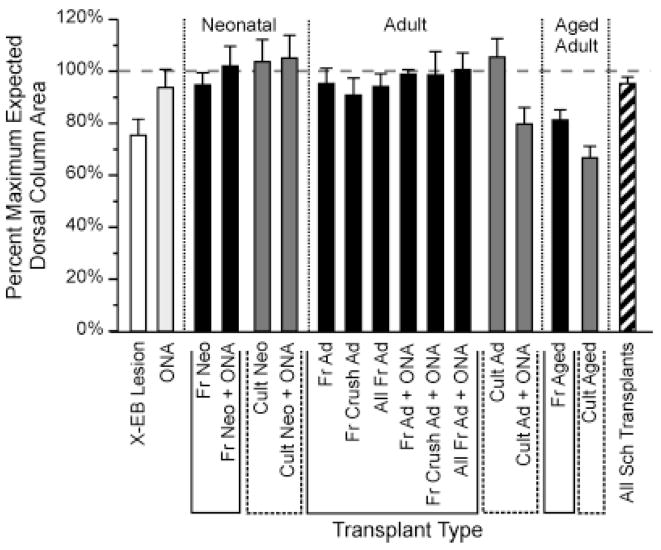
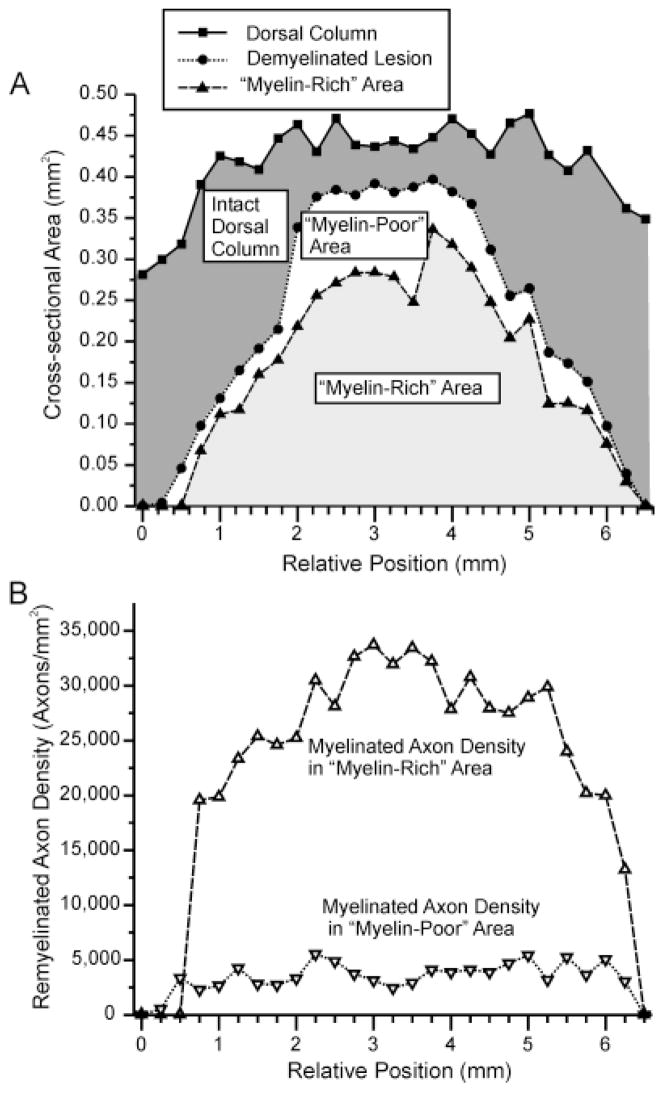
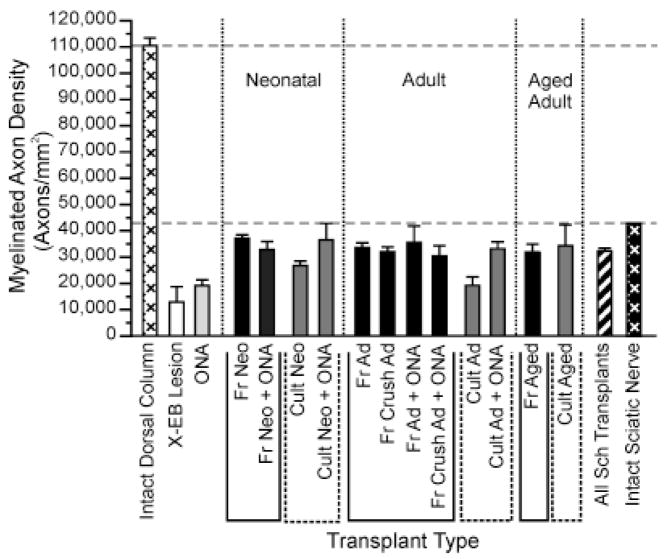
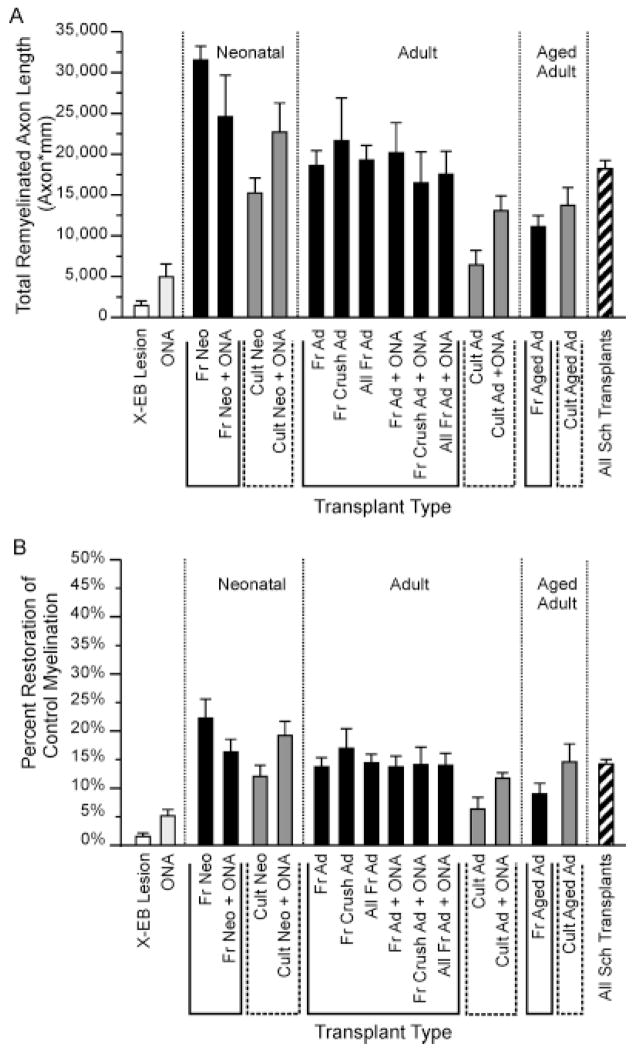
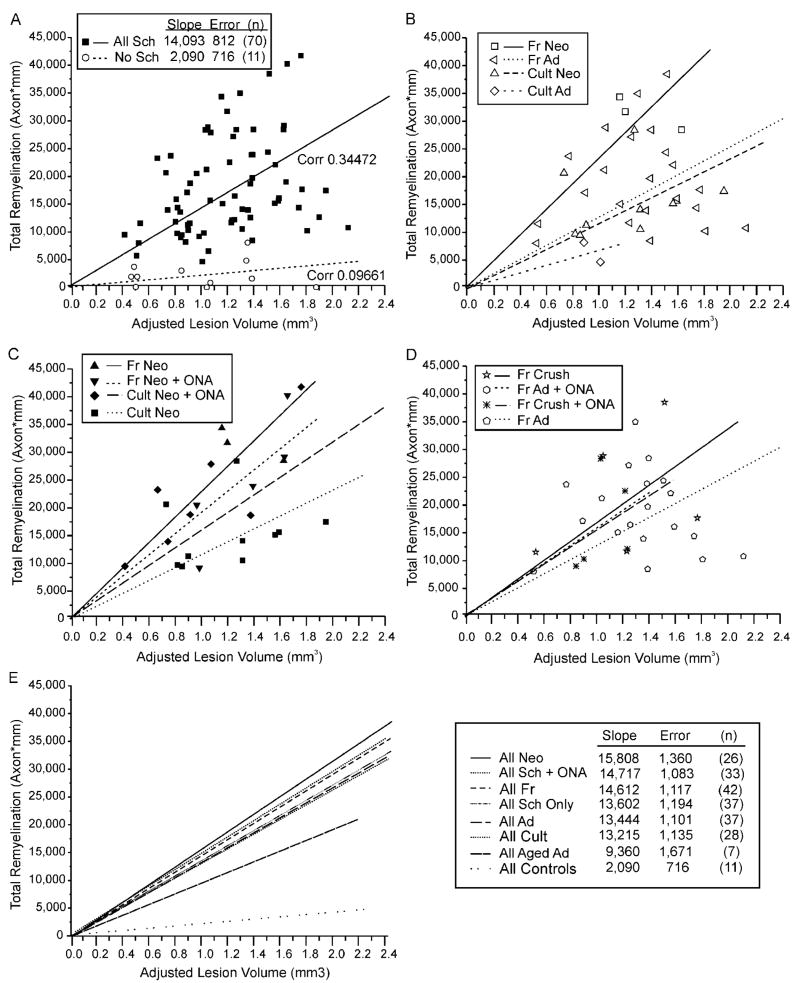
Quantitative morphometric techniques were used to assess the extent and pattern of remyelination produced by transplanting allogenic Schwann cells into demyelinated lesions in adult rat spinal cords. The effects of donor age, prior culturing of donor cells, prior lesioning of donor nerves, and host immunosuppression were evaluated by transplanting suspensions of 30,000 acutely dissociated or cultured Schwann cells from neonatal, young adult, or aged adult rat sciatic nerves into X-irradiation and ethidium bromide-induced demyelinated dorsal column lesions, with or without co-transplantation of neonatal optic nerve astrocytes. Three weeks after transplantation, spinal cords were processed for histological analysis. Under all Schwann cell transplant protocols, large areas containing many Schwann cell-like myelinated axon profiles could be readily observed throughout most of the lesion length. Within these "myelin-rich" regions, the vast majority of detectable axons showed a peripheral-like pattern of myelination. However, interaxonal spacing also increased, resulting in densities of myelinated axons that were more similar to peripheral nerve than intact dorsal columns. Freshly isolated Schwann cells remyelinated more axonal length than cultured Schwann cells, and cells from younger donors remyelinated slightly more axon length than cells from older donors, but all Schwann cell transplant protocols remyelinated tens of thousands of millimeters of axon length and remyelinated axons at similar densities. These results indicate that Schwann cells prepared under a variety of conditions are capable of eliciting remyelination, but that the density of remyelinated axons is much lower than the myelinated axon density in intact spinal cords.


Figures

Fig. 1
Fig. 1
Diagram illustrating the basic protocol used in this study. Demyelinating lesions were created in the dorsal columns of adult rats using X-irradiation and ethidium bromide injections. Cells were transplanted into the centers of lesions, and rats were sacrificed 3 weeks after transplantation. Spinal cords were processed for histological analysis, and cross-sectional areas of the dorsal funiculus, the lesion, and “myelin-rich” and “myelin-poor” areas within the lesion were measured and densities of myelinated axons were counted within each region at 0.25-mm intervals along the spinal cord. These values were used to calculate the total amount of axon length remyelinated and to estimate the percentage of myelin restoration.
Fig. 2
Fig. 2
Photomicrographs illustrating cross sections of a representative intact (A, A′) and X-EB-lesioned adult rat dorsal column (B, B′). Pairs of micrographs show low (A, B) and high (A′, B′) magnification images taken in the center of an X-EB lesion and at the same spinal cord level in an intact control animal. High densities of myelinated fibers and relatively few nonmyelinated fibers were observed in the intact control dorsal column, whereas X-EB lesioned areas consisted almost exclusively of nonmyelinated axon profiles, phagocytotic cells, and myelin debris. Note the slight reduction in dorsal column area in the X-EB-lesioned condition compared with the intact dorsal column, which was typical of X-EB lesions without cell transplantation. All photomicrographs were digitally captured with an Image 1 processing system, with signal averaging and contrast enhancement. For abbreviations, see list. Scale bars = 0.5 mm in B; 0.01 mm in B′.
Fig. 3
Fig. 3
Photomicrographs of representative X-EB lesions with transplanted Schwann cells. Low and high magnification pairs of photomicrographs were taken in the centers of demyelinated lesions transplanted with 30,000 cultured neonatal Schwann cells (A, A′), freshly isolated young adult Schwann cells (B, B′), freshly isolated young adult Schwann cells with 20,000 cultured optic nerve astrocytes (ONAs) (C, C′), and freshly isolated aged adult Schwann cells (D, D′). Note the characteristic peripheral-like pattern of myelination and increased spacing between myelinated axons in each of the high magnification images, which was evident in all Schwann cell-transplanted conditions compared with the intact condition (Fig. 2A′), and the apparent slight expansion of dorsal column area in A–C, which was common to many Schwann cell-transplanted lesions. Overall appearances of all other Schwann cell-transplanted conditions were similar to those shown here. For abbreviations, see list. See Figure 2 for scale bars: left panels = 0.5 mm, and right panels = 0.01 mm.
Fig. 4
Fig. 4
Bar graph illustrating the effects of X-EB lesions and Schwann cell transplantation on local dorsal column expansion or contraction. Each bar represents the average value for the ratio of the maximum cross-sectional of the dorsal column in the experimental condition compared with that of the intact control dorsal column. White and light gray bars represent control lesions without cell transplantation and control ONA transplants. Solid black and dark gray bars represent transplant protocols using freshly isolated and cultured cells, respectively. Diagonally striped bar represents all Schwann cell transplantation experiments in this study. Vertical dotted lines above the ordinate demarcate groups of protocols using Schwann cells from neonatal (Neo), adult (Ad), or aged adult (Aged) donors, respectively. Solid and dashed lines below the X-axis bracket groups of transplant protocols using freshly isolated (Fr) and cultured (Cult) cells, respectively. N values from left to right were 8, 3, 3, 5,10, 8, 17, 5, 22, 2, 5, 7, 2, 6, 5, 2, and 70, respectively. Labeling conventions and N values also apply to Figures 6 and 7 (see also Table 1). Note that although dorsal column sizes were increased under cell transplantation protocols when compared with X-EB lesions alone, significant expansions of dorsal columns beyond sizes found in intact control animals were rare. Maximal cross-sectional areas for all Schwann cell-transplanted conditions differed significantly from X-EB lesions alone at P < 0.006. Cross-sectional areas of dorsal columns receiving transplants of freshly isolated neonatal Schwann cells alone, freshly isolated neonatal Schwann cells + ONAs, cultured neonatal Schwann cells, freshly isolated adult Schwann cells alone, and freshly isolated adult Schwann cells + ONAs each differed from X-EB lesions alone at P < 0.02 or better (unpaired Student’s t-test). For other abbreviations, see list.
Fig. 5
Fig. 5
Line graphs illustrating the relative distributions and densities of remyelinated axons along the longitudinal axis of a representative X-EB lesion transplanted with 30,000 freshly isolated Schwann cells from a normal young adult rat sciatic nerve. A: Line graph showing cross-sectional areas of the targeted dorsal column area, demyelinated lesion, and myelin-rich region within the lesion at successive 0.25-mm intervals along the rostral/caudal axis. Filled squares, filled circles, and filled triangles, respectively, represent the cross-sectional areas of the entire dorsal column, demyelinated lesion, and myelin-rich region within the lesion. Shaded areas under curves indicate the volumes of the intact or undemyelinated area of the dorsal column, and the myelin-rich and myelin-poor regions within the lesion. Note that the myelin-rich region extends almost throughout the length of the lesion but does not fill the lesion completely at any level. B: Line graph showing the densities of remyelinated axons in myelin-rich and myelin-poor areas along the rostral/caudal axis for the same lesion shown in A. Note the sharp differences between myelinated axon densities in the myelin-rich and poor areas and the relatively uniform density of myelinated axons throughout most of the lesion.
Fig. 6
Fig. 6
Bar graph comparing the highest densities of remyelinated axons observed in myelin-rich areas of Schwann cell-transplanted lesions with myelinated axon densities in intact rat dorsal column and sciatic nerve. Maximum myelinated axon density was defined as the average myelinated axon density in the myelin-rich area of the lesion at the level of the cord with the highest myelinated axon density. Note that maximal myelinated axon densities in Schwann cell-transplanted lesions approached values for intact sciatic nerve (black bars with white cross-hatching) but were much lower than myelinated axon densities in intact dorsal columns (white bars with black cross-hatching). See Figure 4 or Table 1 for N values. For abbreviations, see list.
Fig. 7
Fig. 7
Bar graphs summarizing total remyelination (A) and percent restoration of intact myelination levels (B) observed under many different transplant protocols. (See Materials and Methods for formulas.) Note that transplantation of Schwann cell from donors of any age, with or without ONA co-transplantation, resulted in an increase in both total remyelination and percentage of myelin restoration. Both total remyelination (Mre,Total) and percent myelin restoration (Mrestore) for all Schwann cell-transplanted lesions differ significantly from DMEM-only controls and ONA-transplanted lesions at P < 0.000001 and P < 0.001, respectively (unpaired Student’s t-test). Percent myelin restoration in ONA-only transplant lesions was also increased over DMEM controls at P < 0.06, and total remyelination and percent myelin restoration for each individual cell transplantation protocol, represented by more than two experiments, were increased over controls at P < 0.03 or better (unpaired Student’s t-test). See Figure 4 for or Table 1 for N values. For abbreviations, see list.
Fig. 8
Fig. 8
Relationships among lesion size, individual transplant parameters, and total remyelination for all transplantation protocols (A) and for selected subsets of experiments (B–D). One data point has been suppressed to enhance data separation. A: Summary of remyelination for all protocols. Total remyelination (Mre,Totall) for each experiment is plotted as a function of adjusted lesion size (VLes,Adj). Best-fit lines and correlation coefficients (Corr) are shown for data points representing all control lesions with either DMEM or ONA-only injections, and all Schwann cell-transplant protocols. Note that total remyelination tends to increase with increasing lesion size. B: Relative influences of donor cell age and prior culturing on Schwann cell remyelination. Graph plots individual data points and best-fit lines for transplant protocols using freshly isolated or cultured neonatal or adult Schwann cells without ONA co-transplantation. Note the slightly greater difference between the slopes of the best-fit lines for freshly isolated versus cultured neonatal Schwann cells than between slopes for freshly isolated neonatal versus adult Schwann cells. C: Differential effects of ONA co-transplantation on remyelination by freshly isolated and cultured neonatal Schwann cells. Graph plots individual data points and best-fit lines for transplant protocols using cultured or freshly isolated neonatal Schwann cells with or without co-transplanted ONAs. Note that ONAs slightly increase total remyelination when co-transplanted with cultured Schwann cells, but decrease remyelination when co-transplanted with freshly isolated Schwann cells. D: Effects of prior nerve crush on remyelination. Graph of total remyelination versus lesion size for transplant experiments using freshly isolated young adult Schwann cells from normal sciatic nerves and nerves crushed 1 week prior to harvesting, with or without co-transplanted ONAs. Note that prior nerve crushes result in a small increase in remyelination, comparable to ONA co-transplantation. E: Relationship among lesion size, transplantation protocol, and total remyelination. Graph illustrates best-fit lines for total remyelination as a function of lesion size for the seven major classes of Schwann cell transplant protocols, and for control lesions without Schwann cell transplantation. Inset table summarizes slopes and standard errors of best-fit lines for each experimental group. Note that total remyelination increases with lesion size for all transplant protocols and that all Schwann cell transplants protocols significantly increase total remyelination compared with control lesions.

Similar articles

Cited by

References

    1. Barnett SC, Alexander CL, Iwashita Y, Gilson JM, Crowther J, Clark L, Dunn LT, Papanastassiou V, Kennedy PG, Franklin RJ. Identification of a human olfactory ensheathing cell that can effect transplant-mediated remyelination of demyelinated CNS axons. Brain. 2000;123:1581–1588. - PubMed
    1. Baron-Van Evercooren A. Schwann call transplantation and myelin repair of the CNS. Multiple Sclerosis. 1997;3:157–161. - PubMed
    1. Baron-Van Evercooren A, Gansmuller A, Duhamel E, Pascal F, Gumpel M. Repair of a myelin lesion by Schwann cells transplanted into the adult mouse spinal cord. J Neuroimunol. 1992;40:235–242. - PubMed
    1. Baron van Evercooren A, Duhameal-Clerin E, Bounty JM, Hauw JJ, Gumpel M. Pathways of migration of transplanted Schwann cells in the demyelinated mouse spinal cord. J Neurosci Res. 1993;35:428–438. - PubMed
    1. Berthold CH. Morphology of normal peripheral axons. In: Waxman SG, editor. Physiology and pathobiology of axons. New York: Raven Press; 1978. pp. 3–64.

Publication types

MeSH terms