Comparative Study
. 2002 Jan;13(1):238-50.
doi: 10.1091/mbc.01-06-0317.

Caveolae are highly immobile plasma membrane microdomains, which are not involved in constitutive endocytic trafficking

Affiliations
Comparative Study

Caveolae are highly immobile plasma membrane microdomains, which are not involved in constitutive endocytic trafficking

Peter Thomsen et al. Mol Biol Cell. 2002 Jan.

Abstract

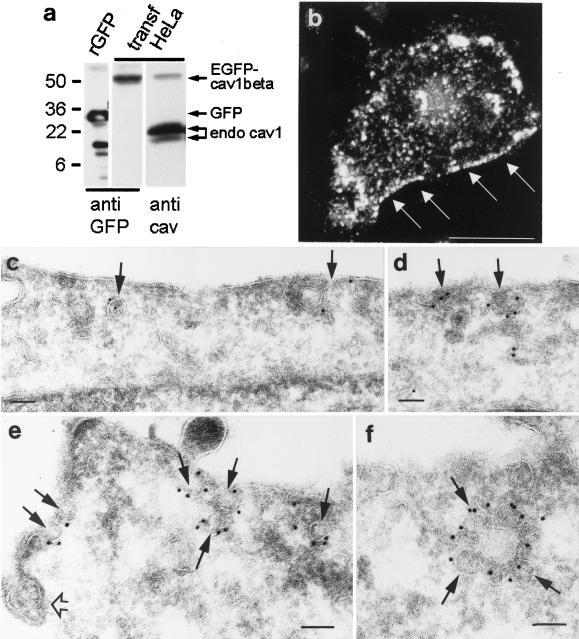
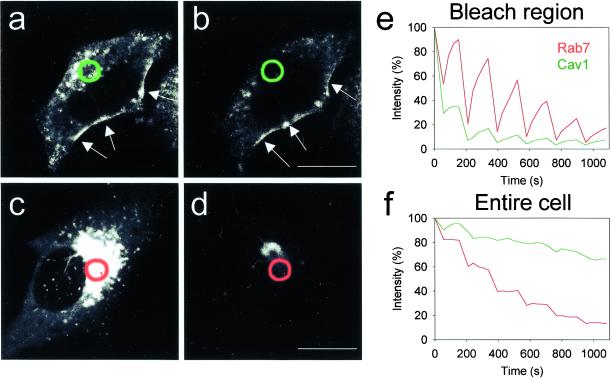
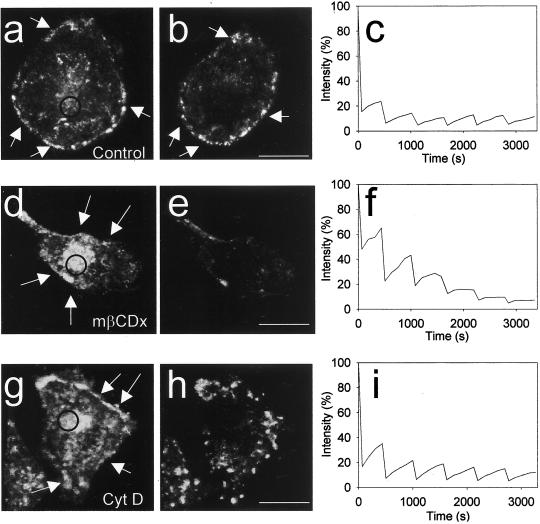
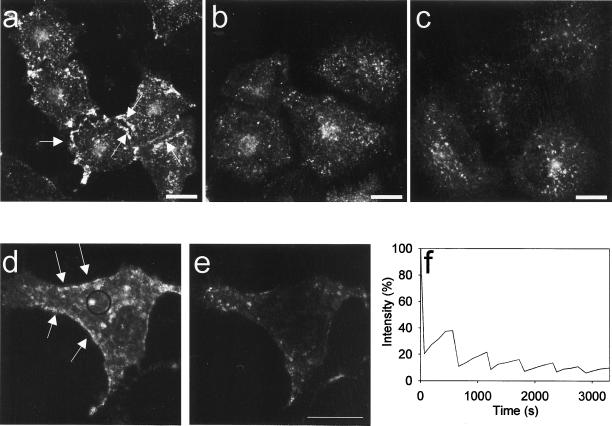
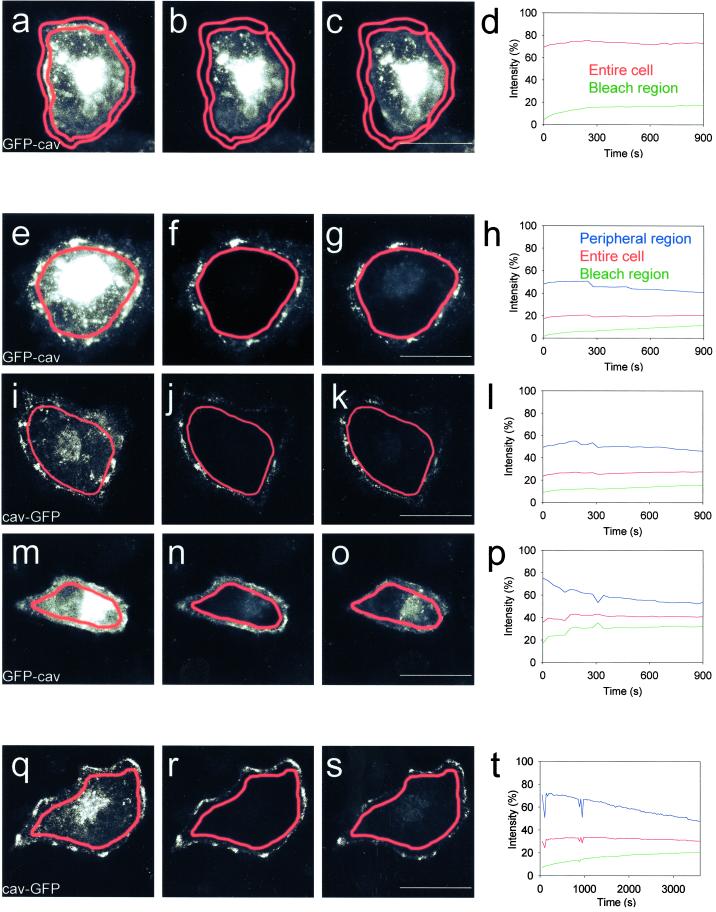
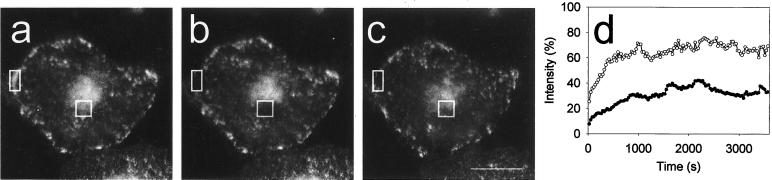
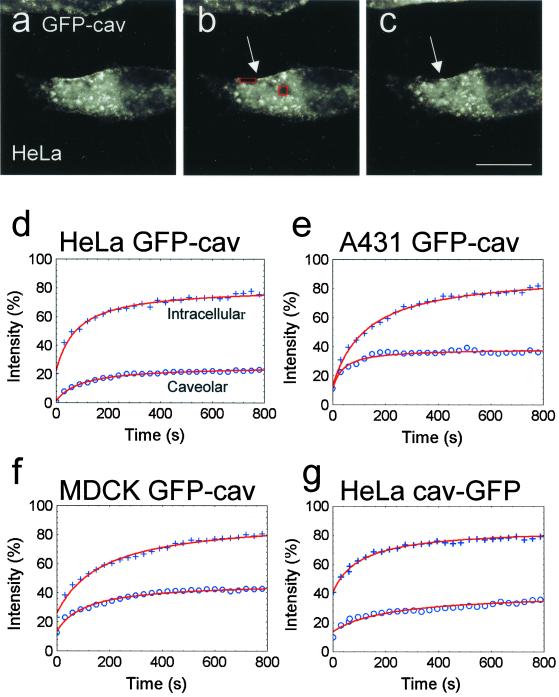
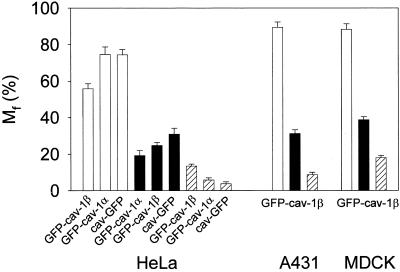
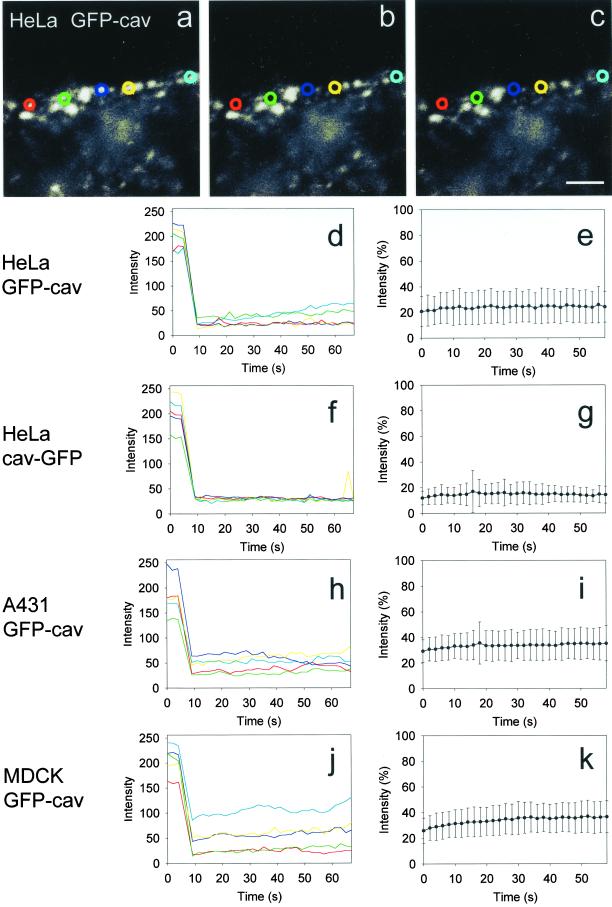
To investigate whether caveolae are involved in constitutive endocytic trafficking, we expressed N- and C- terminally green fluorescent protein (GFP)-tagged caveolin- 1 fusion proteins in HeLa, A431, and Madin-Darby canine kidney cells. The fusion proteins were shown by immunogold labeling to be sorted correctly to caveolae. By using confocal microscopy and photobleaching techniques, it was found that although intracellular structures labeled with GFP-tagged caveolin were dynamic, GFP-labeled caveolae were very immobile. However, after incubation with methyl- beta-cyclodextrin, distinct caveolae disappeared and the mobility of GFP-tagged caveolin in the plasma membrane increased. Treatment of cells with cytochalasin D caused lateral movement and aggregation of GFP-labeled caveolae. Therefore, both cholesterol and an intact actin cytoskeleton are required for the integrity of GFP-labeled caveolae. Moreover, stimulation with okadaic acid caused increased mobility and internalization of the labeled caveolae. Although the calculated mobile fraction (for t = infinity) of intracellular, GFP-tagged caveolin- associated structures was 70-90%, GFP-labeled caveolae in unstimulated cells had a mobile fraction of <20%, a value comparable to that previously reported for E-cadherin in junctional complexes. We therefore conclude that caveolae are not involved in constitutive endocytosis but represent a highly stable plasma membrane compartment anchored by the actin cytoskeleton.


Figures

Figure 1
Figure 1
Expression of GFP-cav in transiently transfected cells. (a) Western blot showing that enhanced GFP-caveolin-1 β (EGFP-cav-1 β) expressed in HeLa cells can be detected as a single band of ∼50 kDa by the use of a polyclonal anti-GFP antibody (anti-GFP) with no signs of degradation. Purified recombinant GFP (rGFP) served as a positive control. A polyclonal anti- caveolin-1 antibody (anti-cav) detects both the GFP-cav-1 β fusion protein and the endogenous caveolin-1 isoforms. (b) 3D reconstruction based on a stack of confocal images of a HeLa cell expressing GFP-cav-1 α. Fluorescent caveolae are in particular distinct at the cell periphery (arrows). Bar, 20 μm. (c–f) Ultracryo sections of GFP- cav-1 β-transfected MDCK cells (c and d) and GFP-cav-1 α transfected HeLa cells (e and f), immunogold labeled with a polyclonal antibody against GFP. The labeling is seen on caveolae (arrows), which sometimes form aggregates (f). An unlabeled clathrin-coated pit (open arrow) is seen in e. Bars, 100 nm.
Figure 2
Figure 2
4D-FLIP analysis of cells expressing GFP-cav and GFP-Rab7. (a and b) Indicated region (green circles) was bleached six times over ∼18 min in a HeLa cell expressing GFP-cav-1 β. The two reconstructed 3D images show the fluorescence of the entire cell immediately before bleaching and at the end of the experiment. (c and d) Indicated region (red circles) was bleached as described above in a HeLa cell expressing GFP-Rab7. (e) Fluorescence intensity of the bleach region of the GFP-cav-1 β-expressing cell (green) and the GFP- Rab7-expressing HeLa cell (red). Note the difference in peak size showing that GFP-Rab7 diffuses much more rapidly into the bleach field than GFP-cav. (f) Fluorescence intensity of the entire GFP-cav-1 β (green) and GFP- Rab7–expressing (red) cell. The GFP-rab7 signal can be completely removed compared with a much more limited extraction of GFP-cav, in particular from caveolae (arrows in a and b). Bars, 20 μm.
Figure 3
Figure 3
4D FLIP analysis of GFP- cav–expressing cells treated with cyclodextrin and cytochalasin. (a and b) 3D reconstructions of a GFP-cav-1 β-expressing HeLa cell immediately before the first of six bleachings (the bleach region is indicated with a circle), and by the end of the experiment, after ∼60 min. (c) Fluorescence intensity of the bleach region. Note that very little fluorescence diffuses into the bleach region after the first bleaching and that the appearance of caveolae (arrows in a and b) is largely unchanged even after 1 h. (d and e) A parallel experiment, in which 10 mM methyl-β-cyclodextrin was added 10 min before the first bleaching. See 4D movie Figure 3, d and e, in the online version. (f) Fluorescence intensity of the bleach region is shown. Note that caveolin here diffuses faster into the bleach region than in the control and that caveolae (arrows in d) disappear over time. (g and h) Experiment in which 10 μg/ml cytochalasin D was added 10 min before the first bleaching. See 4D movie Figure 3, g and h, in the online version. (i) Fluorescence intensity of the bleach region. Note that the normal caveolar pattern (arrows in g) is changed after cytochalasin treatment and that the fluorescence moves into the bleach region more efficiently than in the control. Bars, 20 μm.
Figure 4
Figure 4
3D reconstruction and 4D FLIP analysis of GFP-cav–expressing cells stimulated with okadaic acid. (a) 3D reconstruction of a control HeLa cell expressing GFP-cav-1 β, showing distinctly labeled caveolae (arrows). (b) GFP-cav-1 β-expressing HeLa cells stimulated for 1 h with 1 μM okadaic acid. Endocytosis of caveolae is seen. (c) Endocytosis of caveolae in GFP-cav-1 β-expressing HeLa cells treated for 1 h with 1 μM okadaic acid in 1.6× hypertonic medium. (d and e) 3D stacks from the beginning and the end of a FLIP experiment in which okadaic acid was added 10 min before the first bleaching. Distinct GFP-labeled cavolae are shown by arrows in d. These caveolae became internalized and were bleached within 1 h (e) because they readily moved into the bleach region (f). Bars, 20 μm.
Figure 5
Figure 5
FRAP of the entire caveolar or intracellular GFP-cav and cav-GFP compartments of control cells and cells stimulated with okadaic acid. (a–c) Entire peripheral caveolar compartment (outlined in red) of a HeLa cell expressing GFP-cav-1 β was bleached. Images of the prebleach fluorescence, the fluorescence immediately after bleaching, and 15 min after bleaching is shown. See movie Figure 5, a–c, in the online version. (d) Fluorescence intensity in the peripheral bleach region (green) and of the entire cell (red) after bleaching. (e–g) Intracellular caveolin compartment of a GFP-cav-1 β-expressing HeLa cell was bleached (outlined in red). Images of the prebleach fluorescence, the fluorescence immediately after bleaching, and 15 min after bleaching is shown. See movie Figure 5, e–g, in the online version. (h) Fluorescence intensity of the bleach region (green), the nonbleached peripheral caveolae region (blue), and the fluorescence of the entire cell (red) afterbleaching. (i–l) Intracellular caveolin compartment of a cav-GFP–expressing HeLa cell was bleached (outlined in red). Images and fluorescence intensities presented as in e–h. Note that only very limited exchange of fluorescent material takes place between the caveolar and the intracellular compartment in the control cells shown in a–l. (m–p) Intracellular caveolin compartment of a GFP-cav-1 α- expressing HeLa cell treated with 1 μM okadaic acid was bleached (outlined in red). Okadaic acid was added 10 min before the bleaching. Images and fluorescence intensities presented as in e–h. See movie Figure 5, m–o, in the online version. Note that okadaic acid clearly induces internalization of caveolae. (q–s) Intracellular caveolin compartment of a cav-GFP–expressing HeLa cell (outlined in red) was bleached and the cell followed for 1 h. Images of the prebleach fluorescence, the fluorescence immediately after bleaching, and 1 h after bleaching are shown. (t) Fluorescence intensity of the bleach region (green), the nonbleached peripheral caveolae region (blue), and the fluorescence of the entire cell (red) after bleaching. Bars, 20 μm.
Figure 6
Figure 6
Example of FRAP analysis of intracellular and caveolae-associated cav-GFP. (a–c) Two bleach regions were selected in a cav-GFP–transfected HeLa cell, one in the cell periphery for GFP-labeled caveolae, and one for mainly intracellular, GFP-labeled structures in the perinuclear area. The two bleach regions are shown before bleaching (a), immediately after bleaching (b), and at the end of the experiment, after 1 h (c). (d) Fluorescence recovery curves from the same experiment are shown for caveolae (bottom curve) and intracellular structures (top curve). It is seen that the fluorescence associated with intracellular structures recovers much more efficiently than that associated with caveolae. Bar, 20 μm.
Figure 7
Figure 7
FRAP analysis of intracellular and caveolae-associated GFP-cav. (a–c) Bleach regions selected as in Figure 6 on a GFP-cav-1 β transfected HeLa cell. The two bleach regions are shown before bleaching (a), immediately after bleaching (b), and at the end of the experiment, after ∼15 min (c). See movie Figure 7, a–c, in the online version. Note that the strongly fluorescent caveolar rim adjacent to the peripheral bleach region (arrows in b and c) appears unchanged during the experiment. (d–g) Curve fits of mean values of fluorescence intensities in the bleach regions of fluorescent intracellular structures and caveolae, respectively, within the first 800 s, obtained from 9 to 14 cells per experiment (+, intracellular fluorescence; o, caveolar fluorescence). Values have been normalized (% of prebleach values). It is seen that for all cell types and fusion proteins, the intracellular recovery is much more efficient than the caveolar recovery. Bar, 20 μm.
Figure 8
Figure 8
Mobile fractions (Mf) of intracellular and caveolae-associated caveolin fusion proteins. Mf values for GFP-cav-1 β and cav- GFP, calculated for t = ∞, are based on the curve fits shown in Figure 7. The values for GFP-cav- 1 α are based on similar curve fits. Mf for intracellular fluorescent structures are shown with open bars, and for caveolae-associated fluorescence with filled bars. Moreover, Mf values for caveolae- associated GFP-cav-1 β and cav-GFP, based on the micro- FRAP experiments shown in Figure 9, as well as from micro- FRAP experiments with GFP-cav-1 α in HeLa cells, have been included (hatched bars). SD is indicated by error bars.
Figure 9
Figure 9
Micro-FRAP analysis of caveolae- associated GFP-cav and cav-GFP. (a–c) Five small bleach regions, indicated with different colors, were placed on the peripheral, fluorescent caveolar rim of a GFP-cav-1 β- transfected HeLa cell. The first image (a) represents the prebleach situation, the next image (b) the situation immediately after bleaching, and the last one (c) the end of the experiment after 1 min. See 4D movie Figure 9, a–c, in the online version. (d, f, h, and j) Absolute fluorescence intensities for the experiment with HeLa cells shown in a–c, as well as for a similar experiment with a cav- GFP–transfected HeLa cell, and with GFP-cav-1 β- transfected A431 and MDCK cells, respectively. The colors correspond to the five bleach regions used. (e, g, i, and k) Corresponding, normalized fluorescence intensity in the bleach regions after bleaching (mean ± SD, n = 25 for each experiment). Bar, 2 μm.

References

    1. Adams CL, Chen YT, Smith SJ, Nelson WJ. Mechanisms of epithelial cell-cell adhesion and cell compaction revealed by high-resolution tracking of E- cadherin-green fluorescent protein. J Cell Biol. 1998;142:1105–1119. - PMC - PubMed
    1. Anderson RGW. The caveolae membrane system. Annu Rev Biochem. 1998;67:199–225. - PubMed
    1. Bucci C, Thomsen P, Nicoziani P, McCarthy J, van Deurs B. Rab7. A key to lysosome biogenesis. Mol Biol Cell. 2000a;11:467–480. - PMC - PubMed
    1. Bucci M, Gratton J-P, Rudic RD, Acevedo L, Roviezzo F, Crino G, Sessa WC. In vivo delivery of the caveolin-1 scaffolding domain inhibits nitric oxide synthesis, and reduces inflammation. Nat Med. 2000b;6:1362–1367. - PubMed
    1. Chang WJ, Rothberg KG, Kamen BA, Anderson RGW. Lowering the cholesterol content of MA104 cells inhibits receptor-mediated transport of folate. J Cell Biol. 1992;118:63–69. - PMC - PubMed

Publication types

MeSH terms

LinkOut - more resources