Comparative Study
. 2002 Jan;13(1):285-301.
doi: 10.1091/mbc.01-07-0337.

Biogenesis of N-cadherin-dependent cell-cell contacts in living fibroblasts is a microtubule-dependent kinesin-driven mechanism

Affiliations
Comparative Study

Biogenesis of N-cadherin-dependent cell-cell contacts in living fibroblasts is a microtubule-dependent kinesin-driven mechanism

Sophie Mary et al. Mol Biol Cell. 2002 Jan.

Abstract

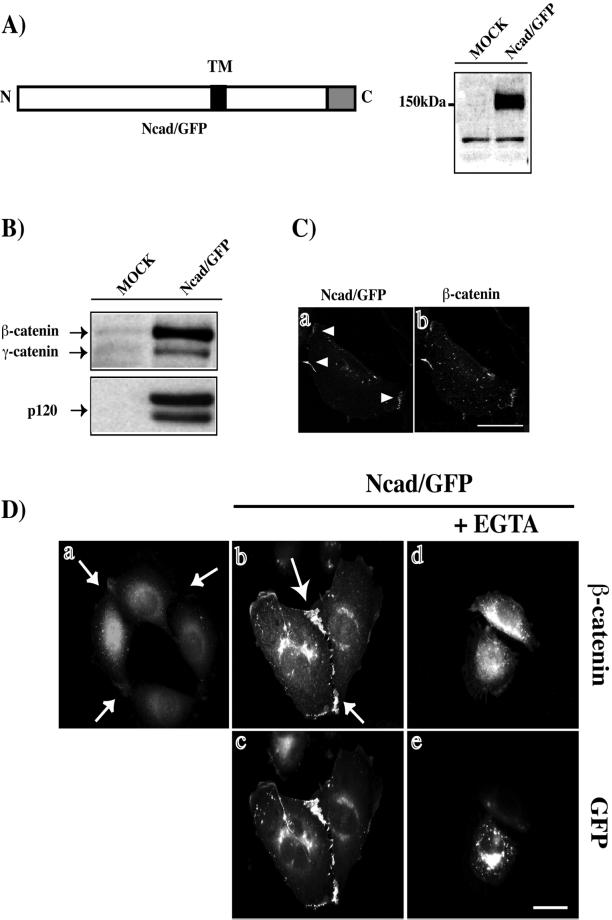
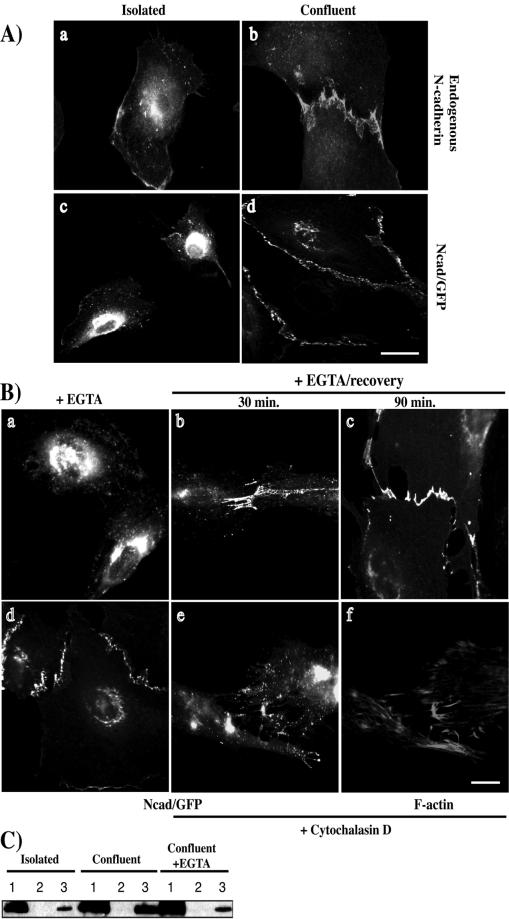
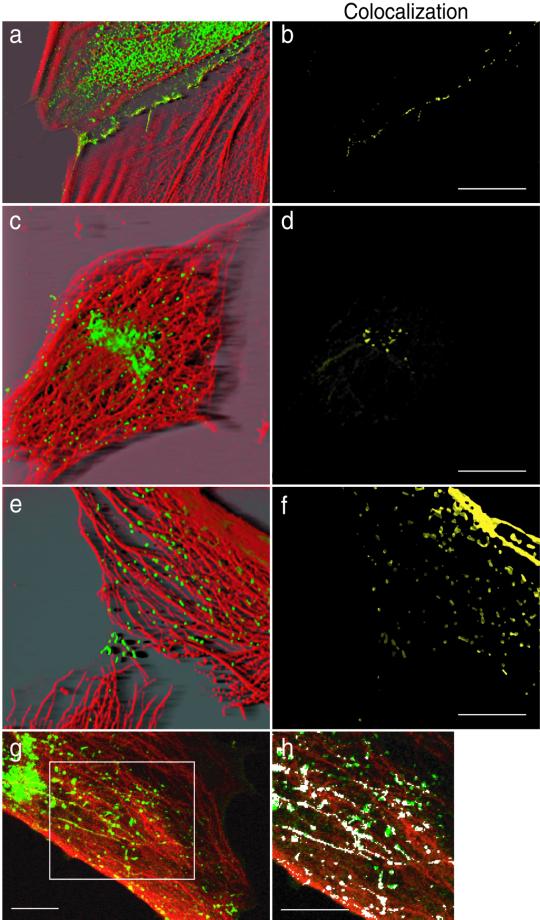
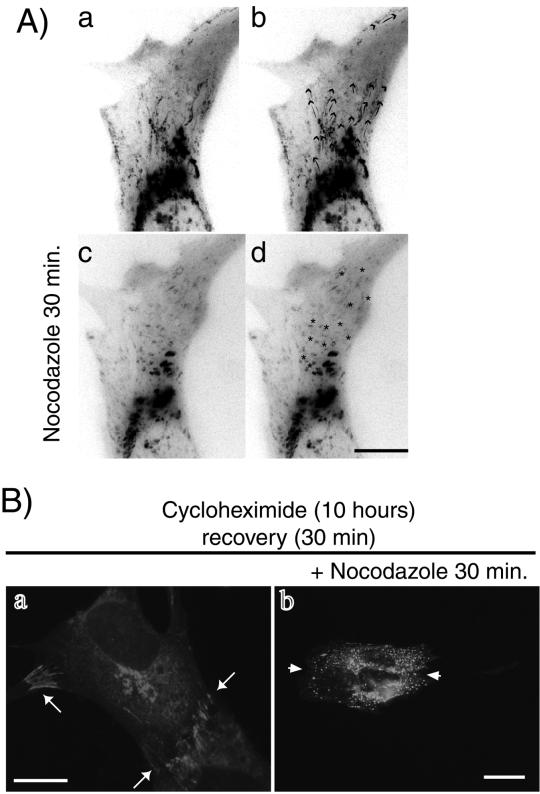
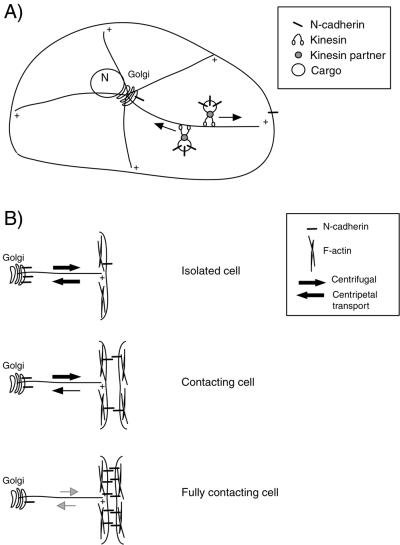
Cadherin-mediated cell-cell adhesion is a dynamic process that is regulated during embryonic development, cell migration, and differentiation. Different cadherins are expressed in specific tissues consistent with their roles in cell type recognition. In this study, we examine the formation of N-cadherin-dependent cell-cell contacts in fibroblasts and myoblasts. In contrast to E-cadherin, both endogenous and ectopically expressed N-cadherin shuttles between an intracellular and a plasma membrane pool. Initial formation of N-cadherin-dependent cell-cell contacts results from the recruitment of the intracellular pool of N-cadherin to the plasma membrane. N-cadherin also localizes to the Golgi apparatus and both secretory and endocytotic vesicles. We demonstrate that the intracellular pool of N-cadherin is tightly associated with the microtubule (MT) network and that junction formation requires MTs. In addition, localization of N-cadherin to the cortex is dependent on an intact F-actin cytoskeleton. We show that N-cadherin transport requires the MT network as well as the activity of the MT-associated motor kinesin. In conclusion, we propose that N-cadherin distribution is a regulated process promoted by cell-cell contact formation, which controls the biogenesis and turnover of the junctions through the MT network.


Figures

Figure 1
Figure 1
Ncad/GFP has properties similar to those of endogenous N-cadherin. (A) GFP was fused to the C terminus of murine N-cadherin (Ncad/GFP). TM, transmembrane region; Greybox, GFP. Cell lysates of Ncad/GFP or mock-transfected REF-52 fibroblasts were analyzed by SDS-PAGE and immunoblotting with an anti-GFP antibody. (B) Cell lysates of Ncad/GFP or mock-transfected REF-52 fibroblasts were immunoprecipitated using an anti-GFP antibody and immunoblotted for the presence of β, γ-catenins and p120. (C) Ncad/GFP-expressing REF-52 fibroblasts were monitored for GFP fluorescence (a) and β-catenin localization (b) by using confocal microscopy. (D) Parental (a) or L cells transfected with plasmids encoding Ncad/GFP (b–e) were stained for β-catenin distribution (a, b, and d). In d and e, cells were treated for 60 min with EGTA. Cells shown are representative of more than 100 observed cells. Bar, 10 μm.
Figure 2
Figure 2
N-cadherin localization is dependent on cell confluence. (A) Isolated (a) and confluent C2 myoblasts (b) were stained for endogenous N-cadherin. Alternatively, exponentially growing REF-52 fibroblasts were transfected with a plasmid encoding Ncad/GFP. Cells were fixed 20 h after transfection and monitored for GFP fluorescence in either isolated (c) or confluent cells (d). (B) Ncad/GFP-expressing cells were treated with EGTA for 30 min (a) followed by a 30- or a 90-min rinse in complete medium (b and c, respectively). Ncad/GFP-expressing cells were treated with cytochalasin D for 15 min (e and f). Control untreated Ncad/GFP-expressing cells are shown in d. After fixation cells were monitored for GFP fluorescence (a–e) or stained with rhodamine-labeled phalloidin (f). Cells shown are representative of >100 observed cells. Bar, 10 μm. (C) Isolated, confluent, or EGTA-treated confluent C2 were lysed in the absence of detergent. Nuclei and associated membranes were pelleted by low-speed centrifugation (lane 1). The supernatant was then subjected to ultracentrifugation, resulting in the isolation of cytosolic extracts (lane 2) and plasma membranes (lane 3). Equal concentrations of proteins from each fraction were analyzed by Western blotting with an anti-N-cadherin antibody.
Figure 3
Figure 3
Intracellular localization of Ncad/GFP. (A) Ncad/GFP-expressing cells were fixed and stained with antibodies against the cis- (p115) (a, inset), medial- (CTR433) (b, inset), and trans-compartments (TGN38) (c, inset) of the Golgi apparatus. Cells were monitored for GFP fluorescence (a–c, green). Shown are confocal images, colocalized red and green pixels appear in white. Cells shown are representative of >100 observed cells. Bar, 10 μm. (B) Precontacting or fully contacting Ncad/GFP-expressing cells were incubated with rhod-Tf for 45 min. After fixation, cells were monitored for GFP (green) and rhodamine fluorescence (red and a and b, insets). Confocal sections revealing the colocalization of Ncad/GFP and rhod-Tf (a and b, white) are shown. (C) Ncad/CFP and VSVG/YFP-expressing cells were monitored for CFP and YFP (a). Colocalization analysis was performed using the Imaris Colocalization module (b).
Figure 4
Figure 4
Post-Golgi transport and fusion at the plasma membrane of Ncad/GFP-containing vesicles. (A) Images of post-Golgi carriers of Ncad/GFP-expressing cells were captured every 3 s. Inverted contrast images are displayed at the indicated time intervals. The arrows indicate different sites where vesicles exit the Golgi. Asterisks indicate bifurcating transport carriers. Bar, 10 μM. (B) Inverted images of Ncad/GFP-expressing cells collected every 3 s. The sequence shows fusion of an Ncad/GFP-containing vesicle with the plasma membrane (black arrow). A different vesicle does not fuse or leaves the plane of focus during this time period (white arrow). Bar, 10 μM.
Figure 5
Figure 5
Ncad/GFP transport is dependent on cell-cell contacts. (A–C) Images of Ncad/GFP-expressing cells were captured every 5 s for 5 min. Projections of all video frames in a movie sequence are shown with the contrast inverted to better visualize the transport paths. Distinct trafficking behaviors are observed in isolated (A), recently (B) or fully contacting cells (C). Circles indicate vesicles with random Brownian-like motion. Inset in B illustrates two centrifugal (1 and 2) and one centripetal (3) pathway. Bar, 10 μM.
Figure 6
Figure 6
Ncad/GFP-containing vesicular structures associate with MTs. Ncad/GFP-expressing cells were fixed and processed for immunofluorescence by using rhodamine-labeled phalloidin and anti-vimentin or anti-α-tubulin antibodies followed by rhodamin-labeled secondary antibodies. Stacks of images were acquired using a wide-field microscope (0.1 μm Z step) and deconvolved using the Huygens System image restoration software. Deconvolved stacks were visualized using the Iview command of the Imaris software (a, c, and e). a, c, and e show the Ncad/GFP (in green), F-actin (a, red), vimentin IF (c, red), and α-tubulin staining (e, red). Respective voxel colocalizations of Ncad/GFP, with F-actin, vimentin, and tubulin obtained using the Imaris Colocalization module are shown in b, d, and f. A single confocal section of Ncad/GFP-expressing cells (green) stained with an anti-α-tubulin antibody (red) is shown in g. h illustrates in white the colocalized objects in the selected area in g. Bar, 10 μm.
Figure 7
Figure 7
Ncad/GFP-containing vesicles cofractionate with microsomes and MTs. (A) Schematic protocol of the different purification steps. (B) SDS-PAGE and immunoblot analysis of Ncad/GFP in the microsomal fraction (C2), MAP-depleted supernatant (S3), and MT/MAP fraction (C3) prepared from isolated, contacting, or Nz-treated isolated Ncad/GFP-expressing cells. Immunoblot detection of a known MAP protein, TOGp, is shown as a control. The amount of tubulin in the fractions is monitored by ponceau red staining of the membranes (middle panels) and immunoblot analysis by using an anti-α-tubulin antibody (bottom panels).
Figure 8
Figure 8
MT disruption affects the movement of Ncad/GFP-containing vesicular structures and junction formation. (A) Images of untreated or Nz-treated recently contacting Ncad/GFP-expressing cells were captured every 5 s for 10 min. Projections of all video frames in a movie sequence from control cells (a and b) or Nz-treated cells (c and d) are shown. Arrows in b show the routes delineated by the Ncad/GFP-containing structures. Asterisks in d indicate structures with random Brownian-like movements. Bar, 10 μM. (B) Ncad/GFP-expressing cells were treated with cycloheximide for 10 h. Cells were rinsed for 30 min (a). Alternatively, cells were incubated with the MT disrupting agent Nz (1 μM) for 30 min and then rinsed in the presence of Nz (b). After fixation, cells were monitored for GFP fluorescence. Bar, 10 μM.
Figure 9
Figure 9
Anti-kinesin antibody affects the movement of Ncad/GFP-containing vesicular structures. (A) Ncad/GFP-expressing cells were microinjected with anti-kinesin H2 antibody and rhodamine-labeled dextran. Sixty minutes after microinjection, images were captured every 5 s for 10 min. Panel a shows the microinjected cells; b is a brightest point projection of all video frames in the stack. Bar, 10 μM. (B) Stacks were analyzed to quantify the movement of Ncad/GFP-containing vesicles. For each condition (noninjected cells, control inert Ig-injected cells, and anti-kinesin H2 antibody-injected cells), six cells were examined.
Figure 10
Figure 10
Model for the regulation of N-cadherin traffic by cell-cell contact formation. (A) N-cadherin is found associated with the Golgi, both secretory and endocytotic vesicles, and the plasma membrane. Both N-cadherin–containing secretory and endocytotic vesicles are moved along MTs by kinesin motor proteins. (B) N-cadherin localization and transport are regulated by cell-cell contact formation. In isolated cells, both centrifugal and centripetal flow of N-cadherin–containing vesicles is observed. In contacting cells, the centripetal transport is diminished, whereas the centrifugal transport is maintained. In fully contacted cells, both centrifugal and centripetal N-cadherin transport is below the detectable level. Once delivered to the plasma membrane, N-cadherin associates, through binding to catenins, with the F-actin cytoskeleton.

References

    1. Adams CL, Nelson WJ, Smith SJ. Quantitative analysis of cadherin-catenin-actin reorganization during development of cell-cell adhesion. J Cell Biol. 1996;135:1899–1911. - PMC - PubMed
    1. Akitaya T, Bronner-Fraser M. Expression of cell adhesion molecules during initiation and cessation of neural crest cell migration. Dev Dyn. 1992;194:12–20. - PubMed
    1. Brady ST, Pfister KK, Bloom GS. A monoclonal antibody against kinesin inhibits both anterograde and retrograde fast axonal transport in squid axoplasm. Proc Natl Acad Sci USA. 1990;87:1061–1065. - PMC - PubMed
    1. Bronner-Fraser M. Mechanisms of neural crest cell migration. Bioessays. 1993;15:221–230. - PubMed
    1. Charrasse S, Schroeder M, Gauthier-Rouviere C, Ango F, Cassimeris L, Gard DL, Larroque C. The TOGp protein is a new human microtubule-associated protein homologous to the XenopusXMAP215. J Cell Sci. 1998;111:1371–1383. - PubMed

Publication types

MeSH terms