. 2001 Dec 15;29(24):5017-28.
doi: 10.1093/nar/29.24.5017.

Distribution of substitution rates and location of insertion sites in the tertiary structure of ribosomal RNA

Affiliations

Distribution of substitution rates and location of insertion sites in the tertiary structure of ribosomal RNA

J Wuyts et al. Nucleic Acids Res. .

Abstract

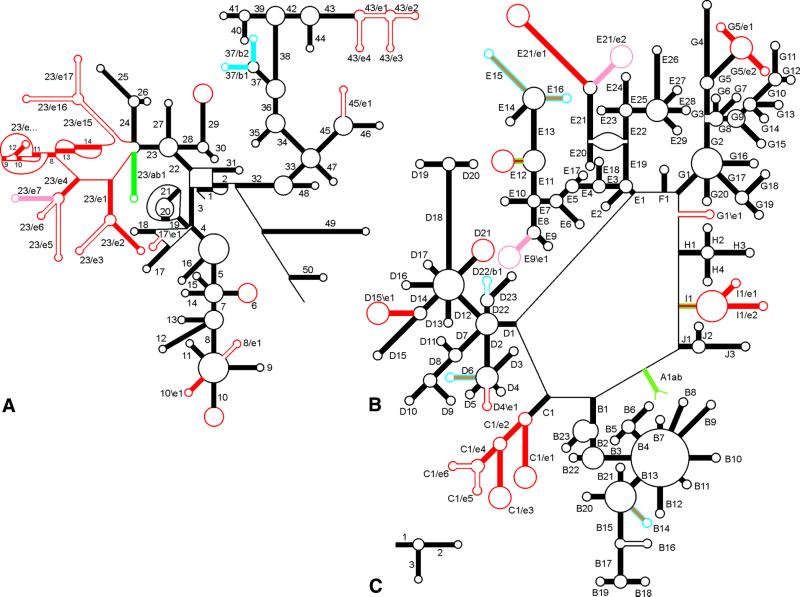
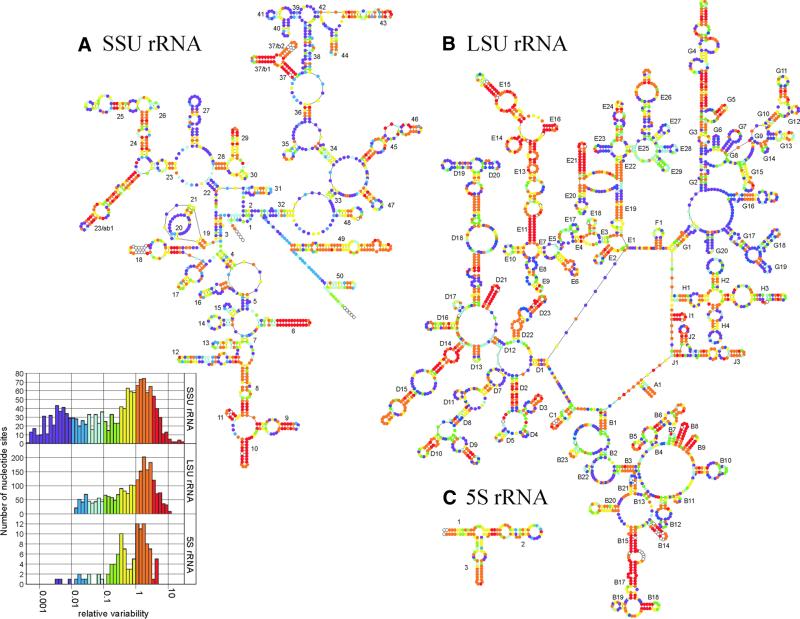
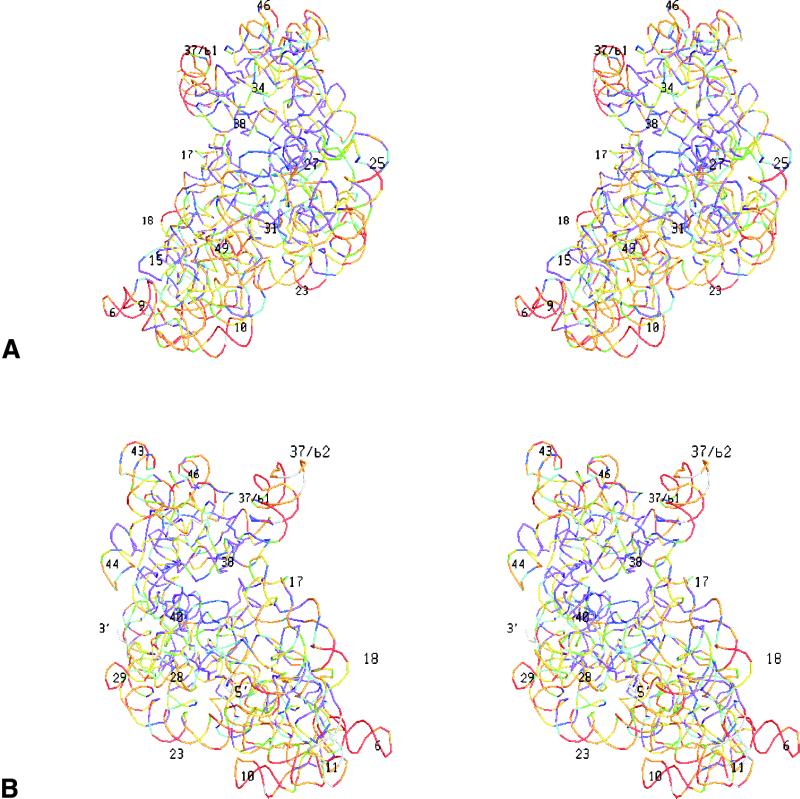
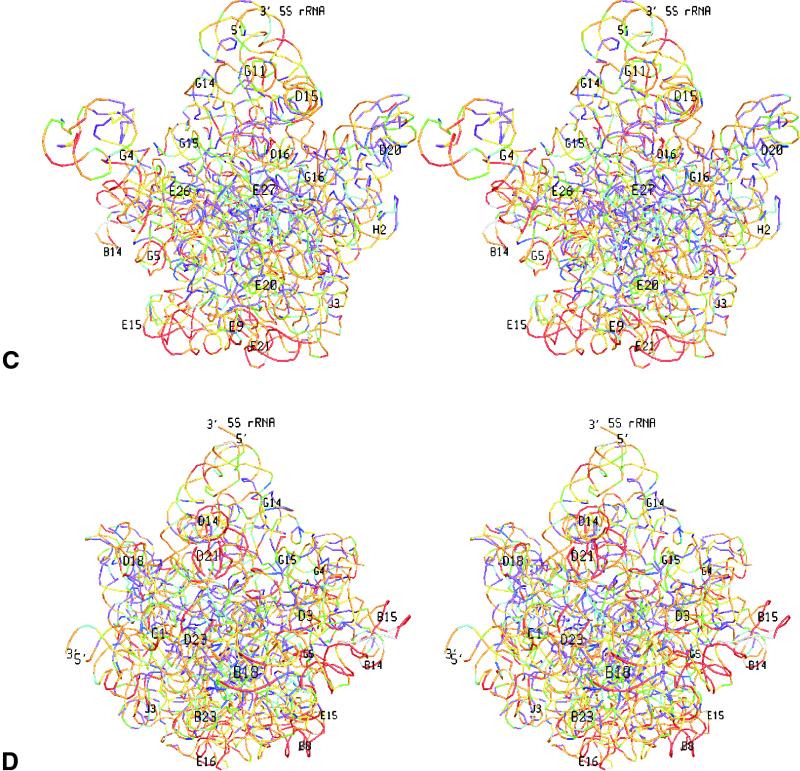
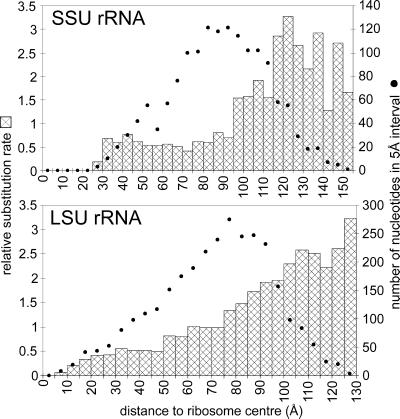
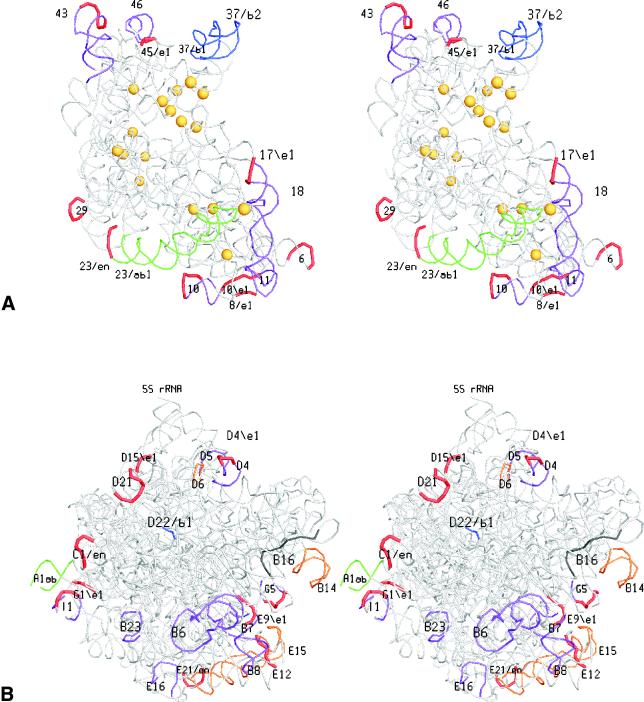
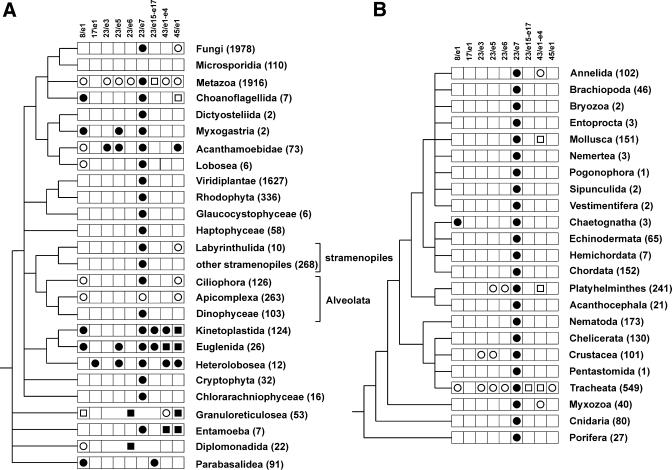
The relative substitution rate of each nucleotide site in bacterial small subunit rRNA, large subunit rRNA and 5S rRNA was calculated from sequence alignments for each molecule. Two-dimensional and three-dimensional variability maps of the rRNAs were obtained by plotting the substitution rates on secondary structure models and on the tertiary structure of the rRNAs available from X-ray diffraction results. This showed that the substitution rates are generally low near the centre of the ribosome, where the nucleotides essential for its function are situated, and that they increase towards the surface. An inventory was made of insertions characteristic of the Archaea, Bacteria and Eucarya domains, and for additional insertions present in specific eukaryotic taxa. All these insertions occur at the ribosome surface. The taxon-specific insertions seem to arise randomly in the eukaryotic evolutionary tree, without any phylogenetic relatedness between the taxa possessing them.


Figures

Figure 1
Figure 1
Secondary structure and helix numbering of SSU rRNA (A), LSU rRNA (B) and 5S rRNA (C). All chains run clockwise from the 5′- to 3′-terminus. The presence of helices in the three domains is indicated as follows (compare with Table 2). Bacteria only, blue; Eucarya only, red or pink; Bacteria + Archaea, green; Eucarya + Archaea, orange; all three domains, black. Solid-coloured helices occur in all species of the domain(s), those shown in outline occur only in a subset. Large red loops in hairpins such as 10 in SSU rRNA and C1/e1 and C1/e3 in LSU rRNA indicate that the loop sequence may form an additional, as yet unknown, structure, for example consisting of further branching, in certain eukaryotic species.
Figure 2
Figure 2
Variability maps of bacterial SSU rRNA (A), LSU rRNA (B) and 5S rRNA (C) superposed on the secondary structure models of the T.thermophilus molecules. Sites are subdivided into seven groups according to their relative substitution rate, coloured purple (lowest rate) to red (highest rate). The rate was not measured for sites occupied in <25% of the sequence alignment, which are shown as hollow dots. The histograms inset to (A) are the substitution rate spectra for the three molecules.
Figure 3
Figure 3
Variability maps superimposed on the tertiary structure of the RNAs in the T.thermophilus SSU and LSU. A stereo drawing of each subunit is shown from the solvent side and from the side of the interface with the other subunit. Each nucleotide is represented by a coloured bar connecting the coordinates of the two adjoining P-atoms. Colours for substitution rate intervals are as in Figure 2. The most easily recognisable helices are numbered, and the 5′- and 3′-termini are indicated. (A) small subunit from interface side; (B) Small subunit from solvent side; (C) large subunit from interface side; (D) large subunit from solvent side.
Figure 3
Figure 3
Variability maps superimposed on the tertiary structure of the RNAs in the T.thermophilus SSU and LSU. A stereo drawing of each subunit is shown from the solvent side and from the side of the interface with the other subunit. Each nucleotide is represented by a coloured bar connecting the coordinates of the two adjoining P-atoms. Colours for substitution rate intervals are as in Figure 2. The most easily recognisable helices are numbered, and the 5′- and 3′-termini are indicated. (A) small subunit from interface side; (B) Small subunit from solvent side; (C) large subunit from interface side; (D) large subunit from solvent side.
Figure 4
Figure 4
Substitution rate of nucleotide sites in SSU rRNA and LSU rRNA as a function of their distance from the ribosome centre. The ribosome centre is defined as the point showing the smallest sum of distances to all P-atoms of the ribosome. Nucleotide sites are identified with the 5′-P-atoms. The bars represent the average relative substitution rate for sets of sites comprised in spherical shells of 5 Å thickness, plotted with 5 Å increments. The dots represent the number of nucleotide sites in each shell.
Figure 5
Figure 5
Domain-specific helices or their attachment points in the tertiary structures of SSU rRNA (A) and LSU rRNA (B). A stereo drawing of each subunit is shown from the solvent side. Domain-specific structures are coloured using the code in Figure 1. For the structures present only in Eucarya, the loops in bacterial rRNAs homologous to insertion points in Eucarya rRNAs are coloured red. Helices deleted in a number of Diplomonadida, Parabasalidea and/or Microsporidia according to the pattern listed in Table 5 are coloured purple. Helices 10, 43, G5 and I1 deleted in some of these protists but bearing insertions in other Eucarya, are coloured purple with a red loop. Yellow spheres in the SSU rRNA drawing indicate insertion points of group I introns in eukaryotic primary transcripts.
Figure 6
Figure 6
Distribution of SSU rRNA supernumerary helices in the phylogeny of the Eucarya domain (left) and the Metazoan kingdom (right). The presence of supernumerary helices or other structures in each taxon are indicated as follows: circle, helix of known structure; square, helix ending in an unknown structure or insertion of entirely unknown structure. A filled symbol indicates that the structure is present in all species of the taxon, an open symbol indicates that it is present in a subset of the species. The number of SSU rRNA sequences examined for each taxon is shown in parentheses after its name. In the Granuloreticulosea and the Diplomonadida the entire area between helices 23 and 24 has an unknown structure. A number of small taxa with an SSU rRNA structure conforming to the eukaryotic core are omitted from the tree.

References

    1. Wimberly B.T., Brodersen,D.E., Clemons,W.M., Morgan-Warren,R.J., Carter,A.P., Vonrhein,C., Hartsch,T. and Ramakrishnan,V. (2000) Structure of the 30S ribosomal subunit. Nature, 407, 327–339. - PubMed
    1. Ban N., Nissen,P., Hansen,J., Moore,P.B. and Steitz,T.A. (2000) The complete atomic structure of the large ribosomal subunit at 2.4 Å resolution. Science, 289, 905–920. - PubMed
    1. Yusupov M.M., Yusupova,G.Zh., Baucom,A., Lieberman,K., Earnest,T.N., Cate,J.H.D. and Noller,H.F. (2001) Crystal structure of the ribosome at 5.5 Å resolution. Science, 292, 883–896. - PubMed
    1. Schwartz R.M. and Dayhoff,M.O. (1978) Ribosomal and other RNAs. In Dayhoff,M.O. (ed.), Atlas of Protein Sequence. National Biomedical Research Foundation, Silver Spring, MD, Vol. 5, supplement 3, pp. 327–337.
    1. Gutell R.R. (1994) Collection of small subunit (16S- and 16S-like) ribosomal RNA structures. Nucleic Acids Res., 22, 3502–3507. - PMC - PubMed

Publication types