

Extensive linkage disequilibrium in small human populations in Eurasia
- PMID: 11813132
- PMCID: PMC384945
- DOI: 10.1086/339258
Extensive linkage disequilibrium in small human populations in Eurasia
Abstract
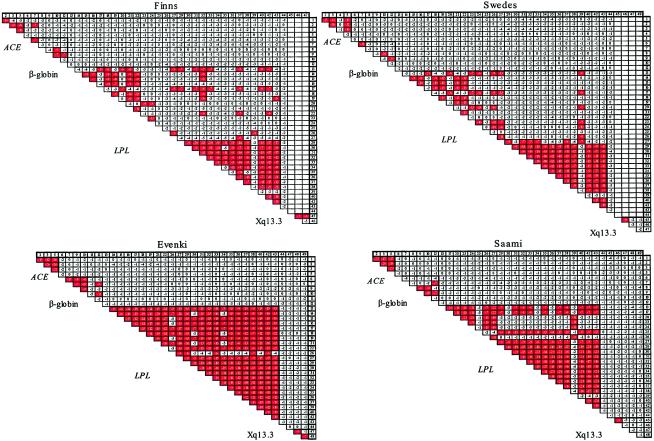
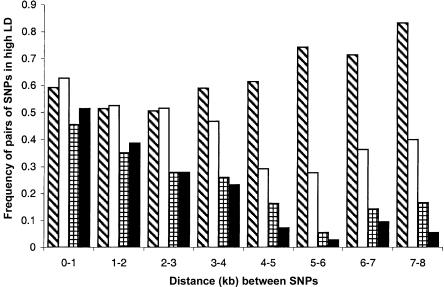
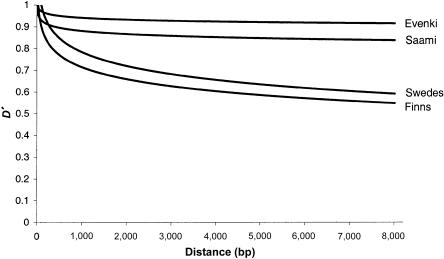
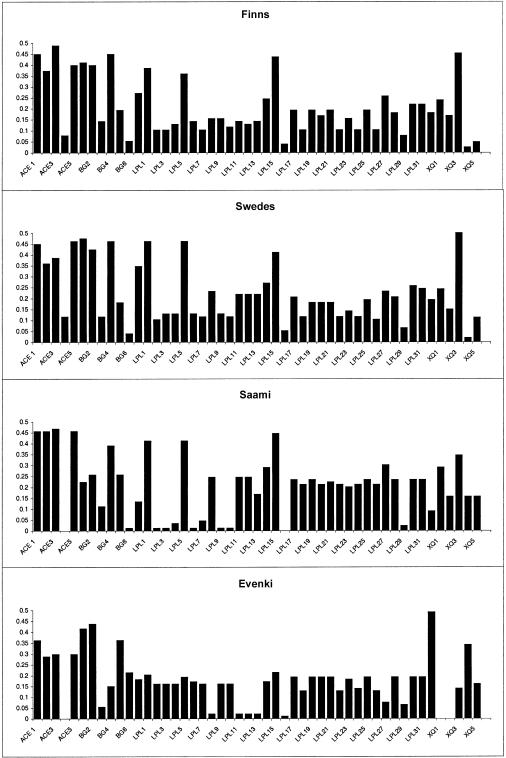
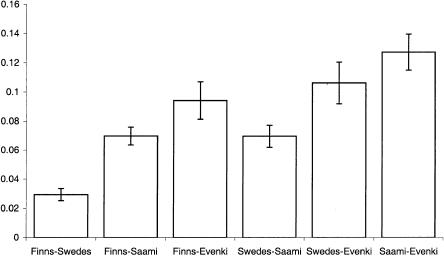
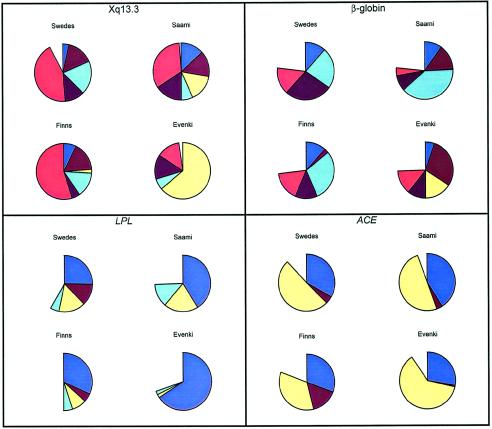
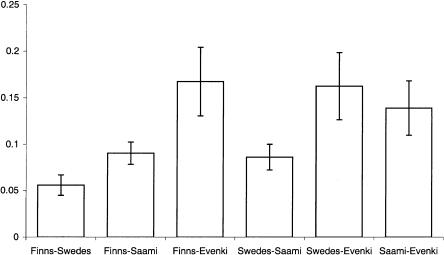
The extent of linkage disequilibrium (LD) was studied in two small food-gathering populations-Evenki and Saami-and two larger food-producing populations-Finns and Swedes-in northern Eurasia. In total, 50 single-nucleotide polymorphisms (SNPs) from five genes were genotyped using real-time pyrophosphate DNA sequencing, whereas 14 microsatellites were genotyped in two X-chromosomal regions. In addition, hypervariable region I of the mtDNA was sequenced to shed light on the demographic history of the populations. The SNP data, as well as the microsatellite data, reveal extensive levels of LD in Evenki and Saami when compared to Finns and Swedes. mtDNA-sequence variation is compatible with constant population size over time in Evenki and Saami but indicates population expansion in Finns and Swedes. Furthermore, the similarity between Finns and Swedes in SNP allele- and haplotype-frequency distributions indicate that these two populations may share a recent common origin. These findings suggest that populations such as the Evenki and the Saami, rather than the Finns, may be particularly suited for the initial coarse mapping of common complex diseases.
Figures
References
Electronic-Database Information
-
- ARLEQUIN, http://lgb.unige.ch/arlequin/
-
- GenBank, http://www.ncbi.nlm.nih.gov/Genbank/ (for markers genotyped for ACE [accession number AF118569], β-globin [accession number L26474], LPL [accession number AF050163], MX [accession number L35674], and Xq13.3 [accession numbers AJ241023–AJ241093])
-
- Mathematical Genetics and Bioinformatics, http://www.stats.ox.ac.uk/mathgen/software.html (for PHASE program)
-
- Project Ensembl, http://www.ensembl.org/
References
-
- Angius A, Melis PM, Morelli L, Petretto E, Casu G, Maestrale GB, Fraumene C, Bebbere D, Forabosco P, Pirastu M (2001) Archival, demographic and genetic studies define a Sardinian sub-isolate as a suitable model for mapping complex traits. Hum Genet 109:198–209 - PubMed
-
- Bertelsmann Lexikon Verlag (1996) Die Völker der Erde: Bertelsmann Lexikon. Bertelsmann, Gütersloh
-
- Daly MJ, Rioux JD, Schaffner SF, Hudson T, Lander ES (2001) High-resolution haplotype structure in the human genome. Nat Genet 29:229–232 - PubMed
-
- Dib C, Faure S, Fizames C, Samson D, Drouot N, Vignal A, Millasseau P, Marc S, Hazan J, Seboun E, Lathrop M, Gyapay G, Morissette J, Weissenbach J (1996) A comprehensive genetic map of the human genome based on 5,264 microsatellites. Nature 380:152–154 - PubMed
Publication types
MeSH terms
Substances
Associated data
- Actions
- Actions
- Actions
- Actions
- Actions
- Actions
- Actions
- Actions
- Actions
- Actions
- Actions
- Actions
- Actions
- Actions
- Actions
- Actions
- Actions
- Actions
- Actions
- Actions
- Actions
- Actions
- Actions
- Actions
- Actions
- Actions
- Actions
- Actions
- Actions
- Actions
- Actions
- Actions
- Actions
- Actions
- Actions
- Actions
- Actions
- Actions
- Actions
- Actions
- Actions
- Actions
- Actions
- Actions
- Actions
- Actions
- Actions
- Actions
- Actions
- Actions
- Actions
- Actions
- Actions
- Actions
- Actions
- Actions
- Actions
- Actions
- Actions
- Actions
- Actions
- Actions
- Actions
- Actions
- Actions
- Actions
- Actions
- Actions
- Actions
- Actions
- Actions
- Actions
- Actions
- Actions
- Actions
LinkOut - more resources
Full Text Sources
Research Materials
