. 2002 Feb;119(2):187-98.
doi: 10.1085/jgp.119.2.187.

Acetylcholine-induced calcium signaling and contraction of airway smooth muscle cells in lung slices

Affiliations

Acetylcholine-induced calcium signaling and contraction of airway smooth muscle cells in lung slices

Albrecht Bergner et al. J Gen Physiol. 2002 Feb.

Abstract

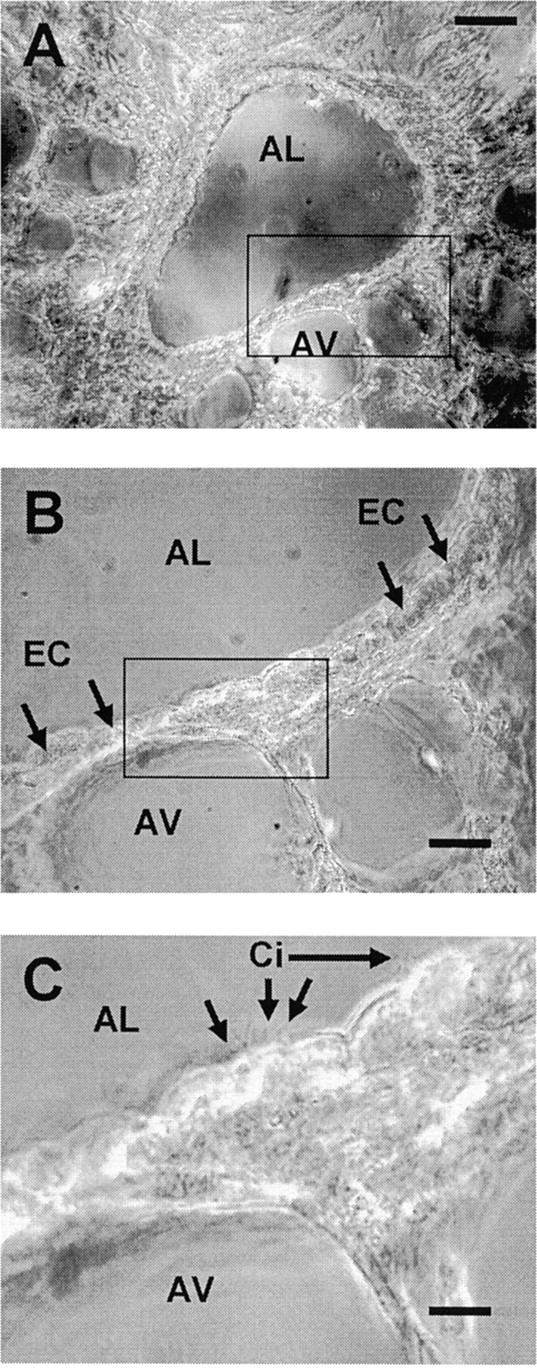
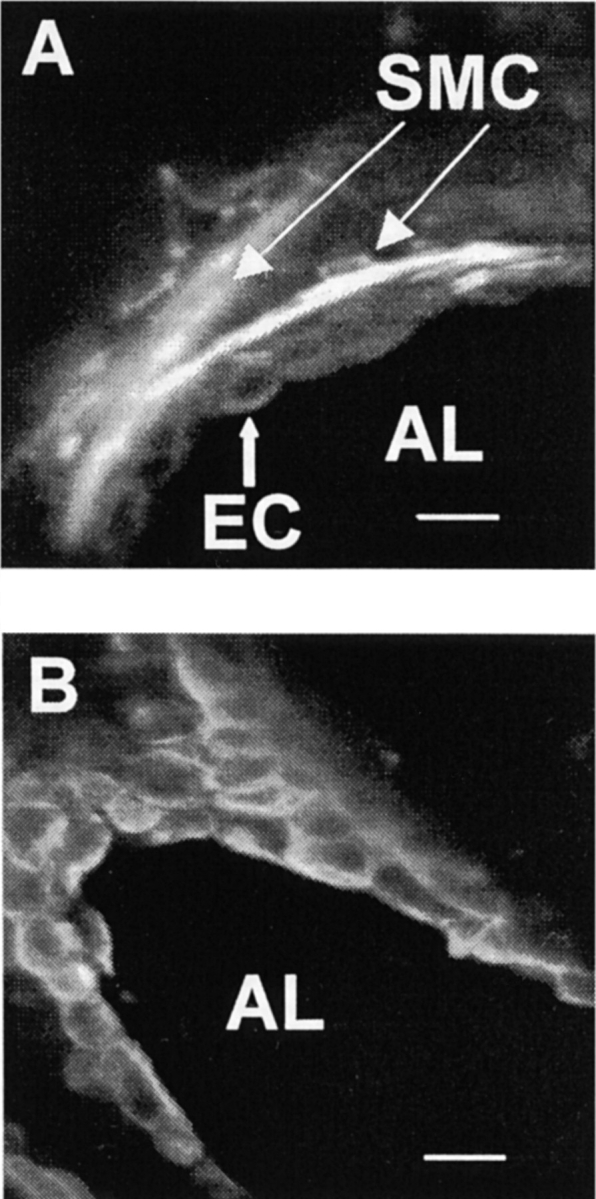
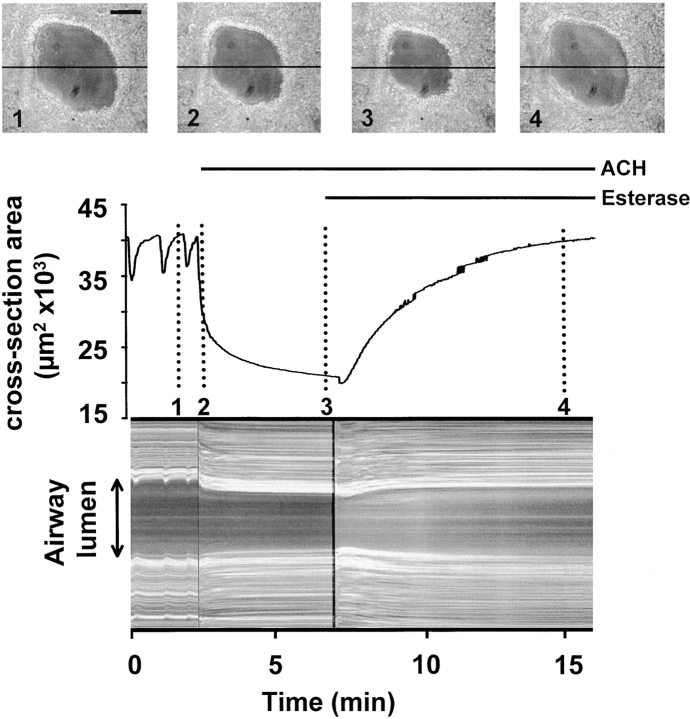
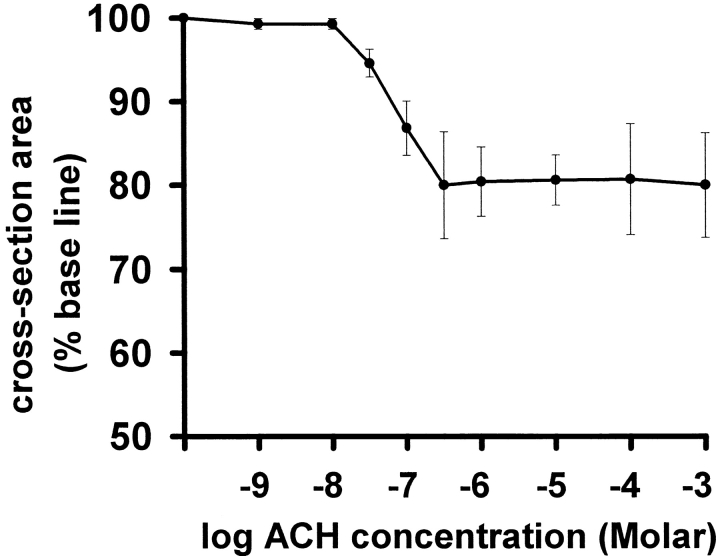
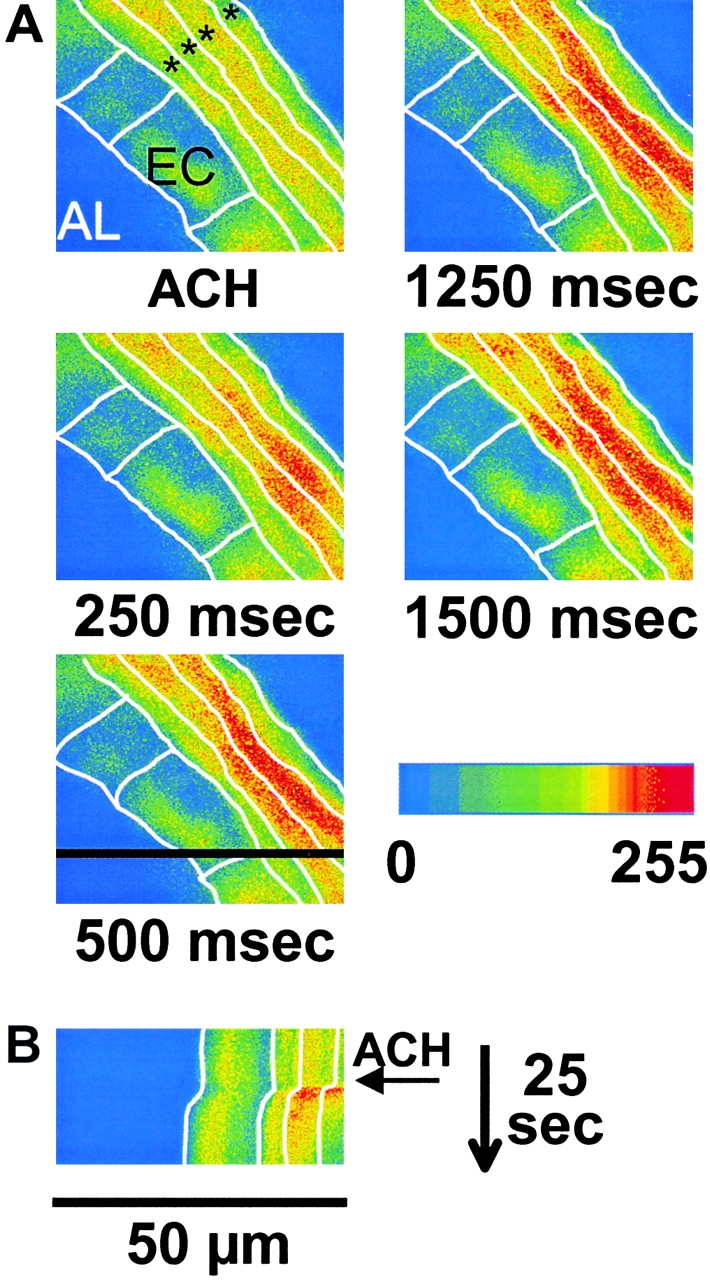
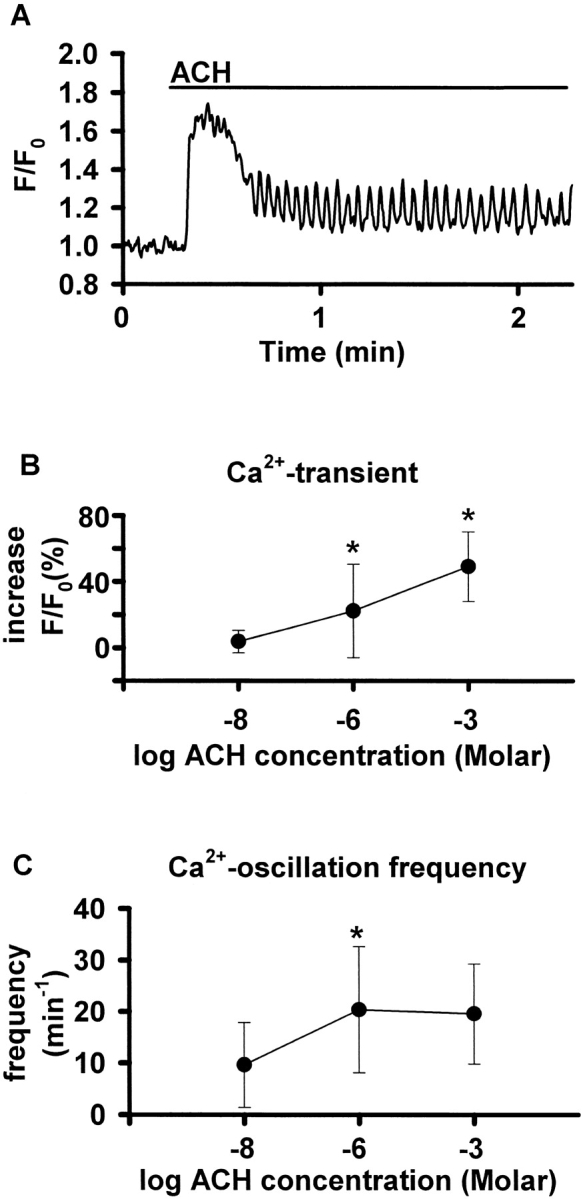
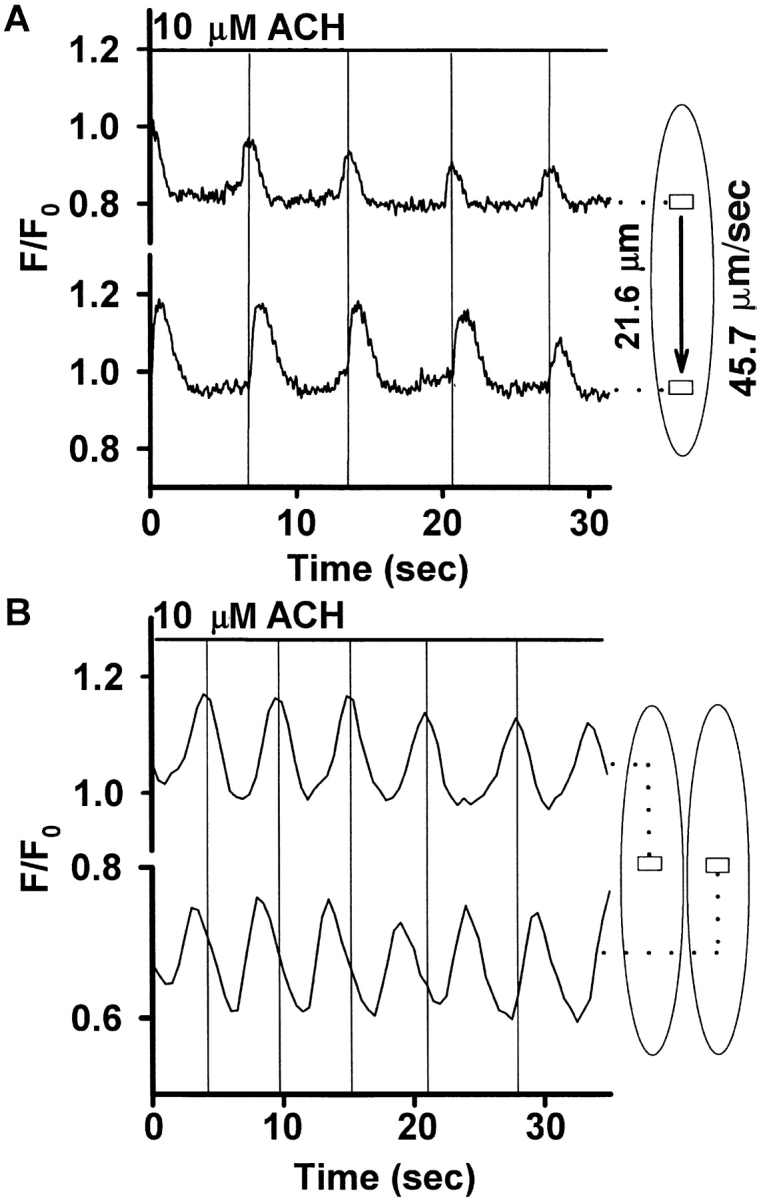
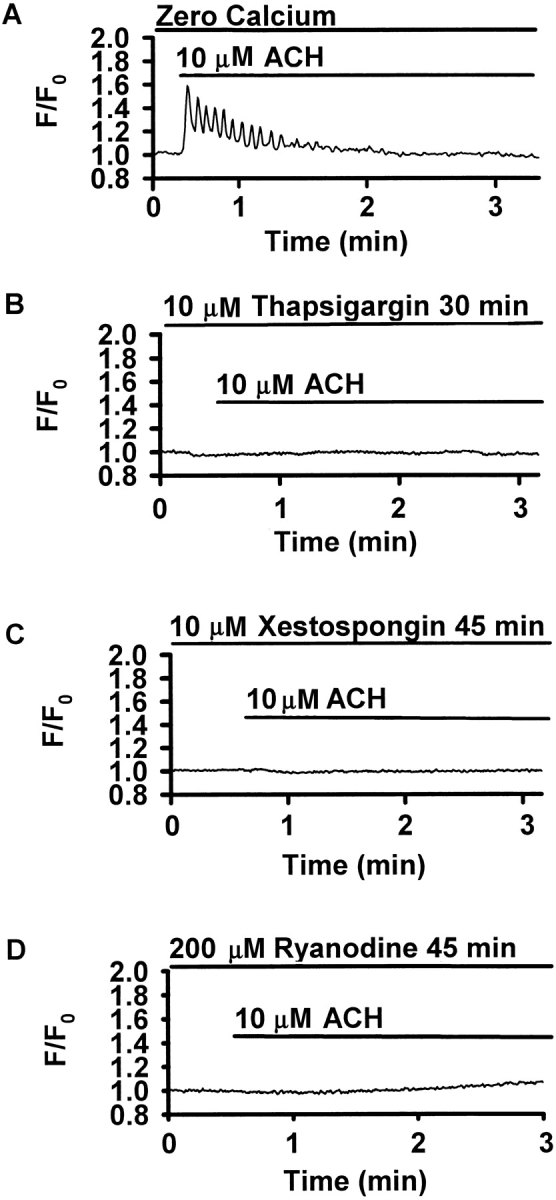
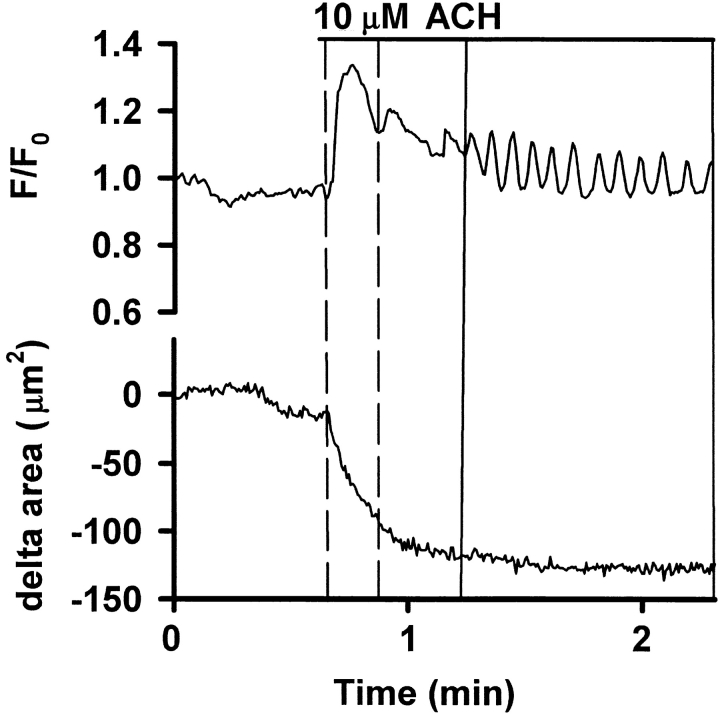
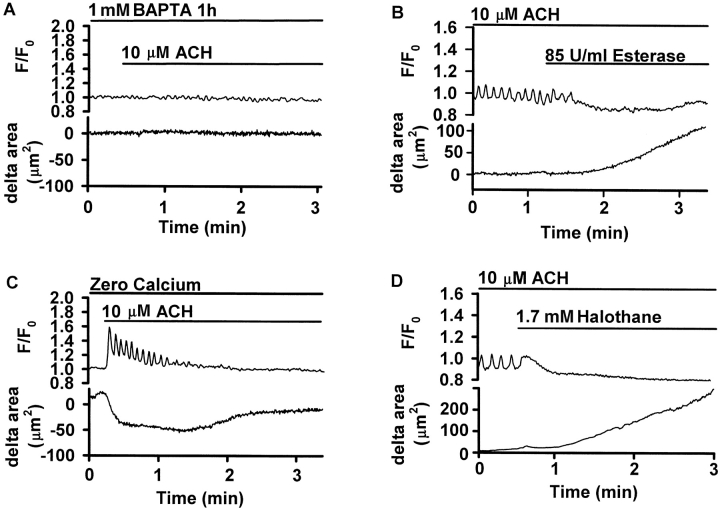
The Ca(2+) signaling and contractility of airway smooth muscle cells (SMCs) were investigated with confocal microscopy in murine lung slices (approximately 75-microm thick) that maintained the in situ organization of the airways and the contractility of the SMCs for at least 5 d. 10--500 nM acetylcholine (ACH) induced a contraction of the airway lumen and a transient increase in [Ca(2+)](i) in individual SMCs that subsequently declined to initiate multiple intracellular Ca(2+) oscillations. These Ca(2+) oscillations spread as Ca(2+) waves through the SMCs at approximately 48 microm/s. The magnitude of the airway contraction, the initial Ca(2+) transient, and the frequency of the subsequent Ca(2+) oscillations were all concentration-dependent. In a Ca(2+)-free solution, ACH induced a similar Ca(2+) response, except that the Ca(2+) oscillations ceased after 1--1.5 min. Incubation with thapsigargin, xestospongin, or ryanodine inhibited the ACH-induced Ca(2+) signaling. A comparison of airway contraction with the ACH-induced Ca(2+) response of the SMCs revealed that the onset of airway contraction correlated with the initial Ca(2+) transient, and that sustained airway contraction correlated with the occurrence of the Ca(2+) oscillations. Buffering intracellular Ca(2+) with BAPTA prohibited Ca(2+) signaling and airway contraction, indicating a Ca(2+)-dependent pathway. Cessation of the Ca(2+) oscillations, induced by ACH-esterase, halothane, or the absence of extracellular Ca(2+) resulted in a relaxation of the airway. The concentration dependence of the airway contraction matched the concentration dependence of the increased frequency of the Ca(2+) oscillations. These results indicate that Ca(2+) oscillations, induced by ACH in murine bronchial SMCs, are generated by Ca(2+) release from the SR involving IP(3)- and ryanodine receptors, and are required to maintain airway contraction.


Figures

F<sc>igure</sc> 1.
Figure 1.
Phase-contrast images of a lung slice, ∼75-μm thick, cut from agarose-filled murine lungs. (A) A low magnification image of a single airway in the lung slice. The airway is cut in cross-section and has a clearly visible lumen (AL). Several adjacent thin-walled alveoli (AV) are also evident. (B) A higher magnification view of the area outlined by the rectangle in A showing the epithelial cells (EC) that line the airway lumen. (C) A higher magnification of the area outlined by the rectangle in B showing the cilia (Ci) of the epithelial cells facing toward the airway lumen. Bars: (A) 50 μm; (B) 20 μm; (C) 8 μm.
F<sc>igure</sc> 2.
Figure 2.
Confocal microscopy images of immunocytochemical stainings of airways in lung slices using FITC-conjugated secondary antibodies. (A) The wall of an airway, cut in cross-section, after staining with anti–α-actin antibodies. Several smooth muscle cells (SMC) stained brightly, show an elongated fusiform cell shape, and are in close spatial proximity to epithelial cells (EC) and airway lumen (AL). (B) A slice stained with anti–pan cytokeratin antibodies showing the typical cobblestone-like appearance of epithelial cells. In this case, the plane of the section has passed obliquely through the airway to provide near longitudinal section at the top left. Bars: 15 μm.
F<sc>igure</sc> 3.
Figure 3.
The change in the cross-sectional area of an airway in response to acetylcholine (ACH). An airway was monitored with phase-contrast microscopy and recorded in time-lapse at 1 frame/s in response to 1 μM ACH and 85 U/ml ACH-Esterase. (top, 1–4) Four images of the airway at different times (indicated by the dotted lines) showing the change in lumen size over 15 min. (middle) The cross-sectional area of the lumen was calculated and plotted against time. The airway displayed a number of spontaneous contractions followed by a large contraction in response to the application of ACH (bar). 1 μM ACH induced an airway contraction of ∼50%. An initial steep phase of fast narrowing was followed by an asymptotic phase. The addition of 85 U/ml ACH-Esterase (bar) led to a short transient contraction followed by a relaxation of the airway back to baseline. (bottom) A line-scanning analysis of the airway responses induced by ACH and ACH-Esterase. Gray values of a single line across each image (black line in phase images 1–4) were sequentially aligned (vertically) to produce a 1-D temporal image of the activity. Trace is representative of eight experiments performed in eight different airways in eight different slices from two different mice. Bar: 50 μm.
F<sc>igure</sc> 4.
Figure 4.
The concentration-response curve of ACH-induced airway contraction. Airways in lung slices were exposed to ACH and the minimum cross-sectional area was determined. A decrease in cross-sectional area occurs in the range of 10–500 nM. Concentrations of 1 μM or higher did not further decrease the minimum cross-sectional area, resulting in a plateau of contraction equal to ∼80%. Each point represents five to eight experiments (mean ± SD) using a different airway in a different slice for each experiment. For each point, slices from at least two different mice were used.
F<sc>igure</sc> 5.
Figure 5.
(A) A series of confocal pseudocolor images showing that epithelial cells (EC) separate the airway lumen (AL) from several adjacent smooth muscle cells (asterisks). In response to 1 μM ACH, the [Ca2+]i is increased in the SMCs but not in the epithelial cells. Each SMC responds with a different time course. Time after the addition of ACH is indicated under each panel. White lines indicate the estimated cell boundaries. (B) A line-scan analysis of the effect of ACH. Intensity values from a single row (black line in image “500 ms”) for each image recorded during 25 s were aligned into a single image. The arrow indicates the addition of ACH. ACH-induced airway contraction occurred simultaneously with the [Ca2+]i increase.
F<sc>igure</sc> 6.
Figure 6.
(A) Ca2+ signaling induced by ACH in airway SMCs in lung slices. ROIs were defined in SMCs and Ca2+ changes in response to 1 μM ACH (bar) expressed as a fluorescence ratio. The Ca2+ response consisted of an initial Ca2+ transient, followed by Ca2+ oscillations. (B and C) Concentration dependence of the Ca2+ response to ACH. Five SMCs in airways of different slices were exposed to 10−8, 10−6, and 10−3 M ACH with a washout and a 20-min recovery period between each exposure (*, P < 0.05). (B) The magnitude of the Ca2+ increase of the initial Ca2+ transient (the percent difference between the F/F0 measured immediately before and at maximum value of the Ca2+ transient) was concentration-dependent. (C) The frequency of the oscillations (the average period of 10 sequential oscillations) at 10−6 M was higher than at 10−8 M, but did not differ between 10−6 and 10−3 M.
F<sc>igure</sc> 7.
Figure 7.
(A) Ca2+ oscillations as intracellular Ca2+ waves. Using confocal microscopy, ACH-induced Ca2+ oscillations were recorded at 60 frames/s. Two ROIs in the same SMC (21.6 μm apart) were analyzed, and ACH-induced Ca2+ oscillations displayed simultaneously. The Ca2+ oscillations of the two ROIs were phase-shifted, indicating a Ca2+ wave propagating through the cell. The temporal difference between the ROIs was 0.49 ± 0.11 s, giving a propagating velocity of the Ca2+ wave of 45.7 ± 11.1 μm/s for this cell (n = 5 consecutive oscillations, mean ± SD). Three similar experiments in three different SMCs in three different slices revealed an average propagating velocity of 47.6 ± 9.2 μm/s. (B) Ca2+ oscillations in ROIs in two adjacent cells were recorded and displayed simultaneously. The oscillations were asynchronous, indicating independent Ca2+ responses to ACH.
F<sc>igure</sc> 8.
Figure 8.
Mechanisms of ACH-induced Ca2+ oscillations. Traces are representative of four to five experiments performed in different airways of different slices obtained from at least two different mice. (A) In Ca2+-free solution containing 5 mM EGTA, ACH-induced Ca2+ oscillations were initiated, but ceased after 1–1.5 min. (B) Incubation with 10 μM thapsigargin for 30 min abolished the Ca2+ response to ACH. (C) After a 45-min incubation with 10 μM xestospongin, no Ca2+ response to ACH could be detected. (D) Incubation with 200 μM ryanodine for 45 min also prevented the ACH-induced Ca2+ response.
F<sc>igure</sc> 9.
Figure 9.
Correlation of ACH-induced Ca2+ signaling and airway contraction. ROIs were defined in single SMCs, and the Ca2+ changes in response to 10 μM ACH were expressed as a fluorescence ratio (top trace). The change in the part of the cross-sectional area of the airway that was visible in the confocal images was measured and displayed simultaneously as the delta area (bottom trace). The initial Ca2+ transient correlates with the airway contraction. The occurrence of the Ca2+ oscillations correlates with the maintenance of the reduced airway lumen. Representative traces of five experiments of five different airways in five different slices obtained from two different mice are shown.
F<sc>igure</sc> 10.
Figure 10.
Ca2+ oscillations maintain airway contraction. ROIs were defined in single SMCs and the Ca2+ changes in response to ACH expressed as fluorescence ratio (top). The change in the part of the cross-sectional area of the airway that was visible in the confocal images was measured and displayed simultaneously as the delta area (bottom). Traces are representative of four to five experiments performed in different airways of different slices obtained from at least two different mice. (A) Buffering intracellular Ca2+ by incubation with 1 mM BAPTA-AM for 1 h prevented both, the Ca2+ signaling and the airway contraction in response to 10 μM ACH (bar). (B) During ongoing ACH-induced Ca2+ oscillations, the addition of 85 U/ml ACH-Esterase (bar) abolished the Ca2+ oscillations without substantially changing baseline [Ca2+]i and relaxed the airway. (C) In a Ca2+-free solution containing 5 mM EGTA, the addition of 10 μM ACH (bar) induced Ca2+ oscillations and airway contraction. However, after 1–1.5 min, the Ca2+ oscillations ceased and the airway relaxed. (D) 1.7 mM halothane abolished ongoing Ca2+ oscillations and simultaneously relaxed the airway.

References

    1. Berridge, M.J., P. Lipp, and M.D. Bootman. 2000. The versatility and universality of calcium signalling. Nat. Rev. Mol. Cell Biol. 1:11–21. - PubMed
    1. Bootman, M.D., T.J. Collins, C.M. Peppiatt, L.S. Prothero, L. MacKenzie, P. De Smet, M. Travers, S.C. Tovey, J.T. Seo, M.J. Berridge, et al. 2001. Calcium signalling: an overview. Semin. Cell Dev. Biol. 12:3–10. - PubMed
    1. Dandurand, R.J., C.G. Wang, N.C. Phillips, and D.H. Eidelman. 1993. Responsiveness of individual airways to methacholine in adult rat lung explants. J. Appl. Physiol. 75:364–372. - PubMed
    1. Dandurand, R.J., C.G. Wang, S. Laberge, J.G. Martin, and D.H. Eidelman. 1994. In vitro allergic bronchoconstriction in the brown Norway rat. Am. J. Respir. Crit. Care Med. 149:1499–1505. - PubMed
    1. Di Virgilio, F., T.H. Steinberg, and S.C. Silverstein. 1990. Inhibition of Fura-2 sequestration and secretion with organic anion transport blockers. Cell Calcium. 11:57–62. - PubMed

Publication types