

Downregulation of reduced-folate transporter by glucose in cultured RPE cells and in RPE of diabetic mice
- PMID: 11818404
- PMCID: PMC4639924
Downregulation of reduced-folate transporter by glucose in cultured RPE cells and in RPE of diabetic mice
Abstract
Purpose: The polarized distribution of reduced-folate transporter (RFT)-1 to the apical retinal pigment epithelial (RPE) membrane was demonstrated recently. Nitric oxide (NO) significantly decreases the activity of RFT-1 in cultured RPE cells. NO is elevated in diabetes, and therefore in the present study the alteration of RFT-1 activity in RPE under conditions of high glucose was investigated.
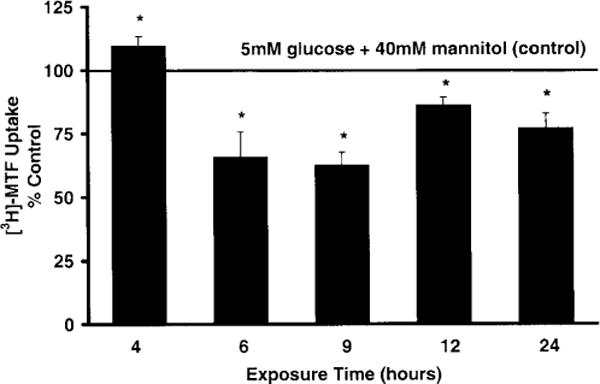
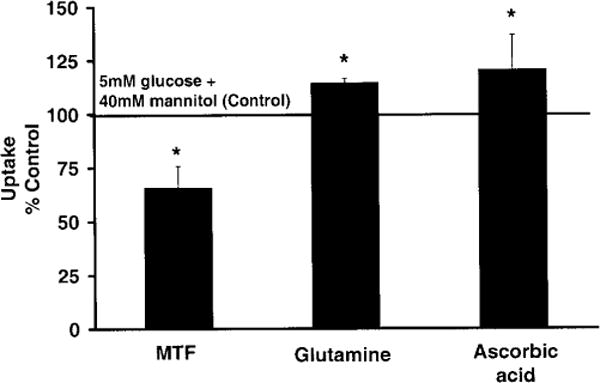
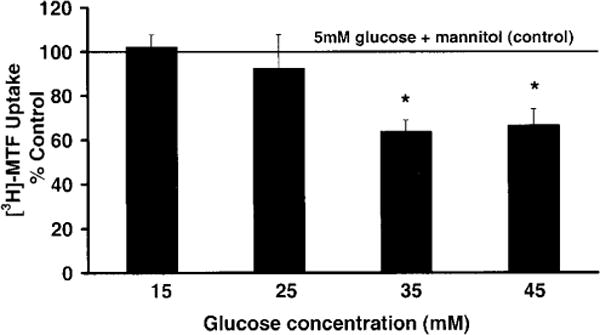
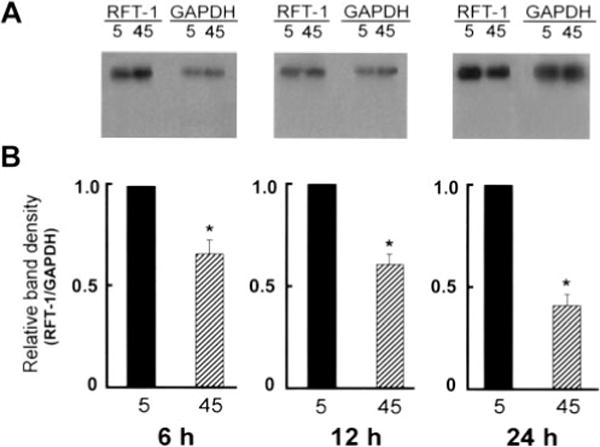
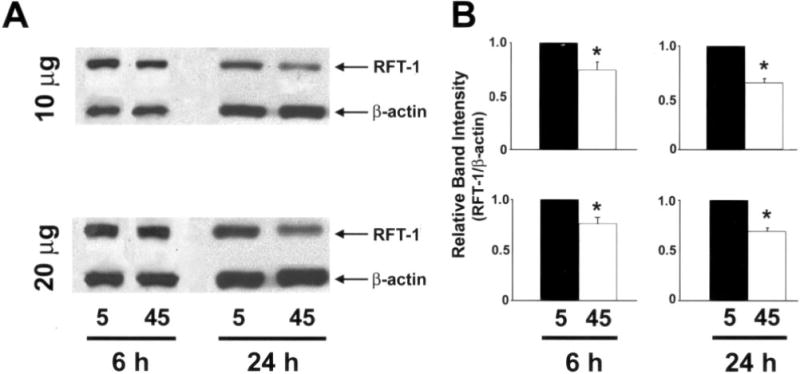
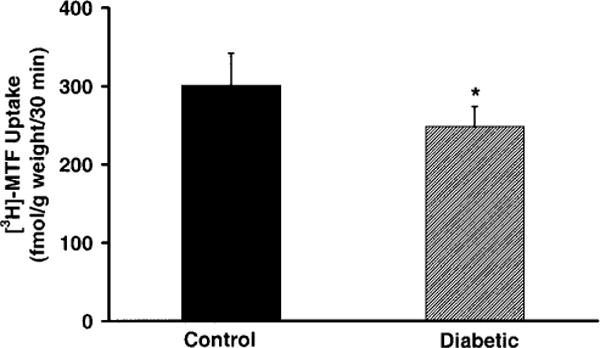
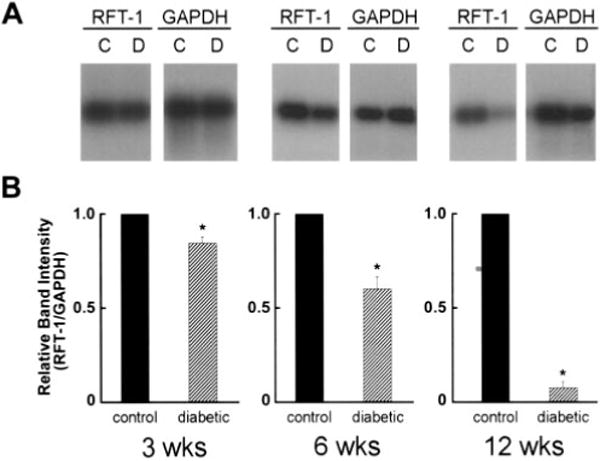
Methods: Human ARPE-19 cells were incubated in media containing 5 mM glucose plus 40 mM mannitol (control) or 45 mM glucose for varying periods and the activity of RFT-1 was assessed by determining the uptake of [3H]-N(5)-methyltetrahydrofolate (MTF). The levels of mRNA encoding RFT-1 were determined by RT-PCR and protein levels by Western blot analysis. The activity of RFT-1 and expression of mRNA encoding RFT-1 were analyzed also in RPE of streptozotocin-induced diabetic mice.
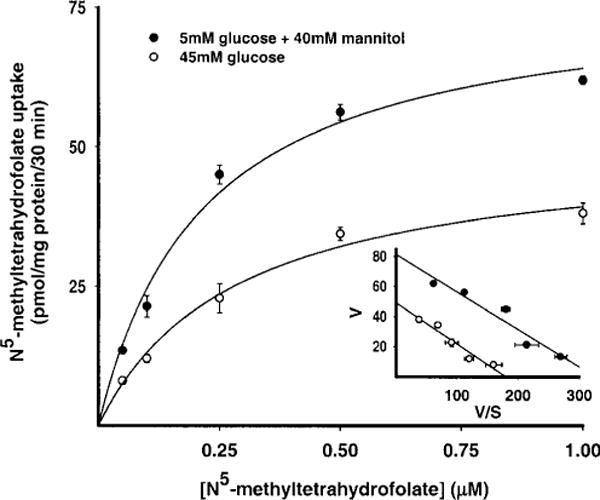
Results: Exposure of RPE cells to 45 mM glucose for as short an incubation time as 6 hours resulted in a 35% decrease in MTF uptake. Kinetic analysis showed that the hyperglycemia-induced attenuation was associated with a decrease in the maximal velocity of the transporter with no significant change in the substrate affinity. Semiquantitative RT-PCR demonstrated that the mRNA encoding RFT-1 was significantly decreased in cells exposed to high glucose, and Western blot analysis showed a significant decrease in protein levels. The uptake of [3H]-MTF in RPE of diabetic mice was reduced by approximately 20%, compared with that in nondiabetic, age-matched control animals. Semiquantitative RT-PCR demonstrated that the mRNA encoding RFT-1 was decreased significantly in RPE of diabetic mice.
Conclusions: These findings demonstrate for the first time that hyperglycemic conditions reduce the expression and activity of RFT-1 and may have profound implications for the transport of folate by RPE in diabetes.
Figures
Similar articles
-
Regulation of reduced-folate transporter-1 in retinal pigment epithelial cells by folate.Curr Eye Res. 2005 Jan;30(1):35-44. Curr Eye Res. 2005. PMID: 15875363 Free PMC article.
-
Regulation of reduced-folate transporter-1 (RFT-1) by homocysteine and identity of transport systems for homocysteine uptake in retinal pigment epithelial (RPE) cells.Exp Eye Res. 2003 Dec;77(6):687-97. doi: 10.1016/j.exer.2003.08.013. Exp Eye Res. 2003. PMID: 14609557
-
Expression and differential polarization of the reduced-folate transporter-1 and the folate receptor alpha in mammalian retinal pigment epithelium.J Biol Chem. 2000 Jul 7;275(27):20676-84. doi: 10.1074/jbc.M002328200. J Biol Chem. 2000. PMID: 10787414
-
Expression of folate receptor alpha in the mammalian retinol pigmented epithelium and retina.Invest Ophthalmol Vis Sci. 1999 Apr;40(5):840-8. Invest Ophthalmol Vis Sci. 1999. PMID: 10102280
-
Polarized expression of monocarboxylate transporters in human retinal pigment epithelium and ARPE-19 cells.Invest Ophthalmol Vis Sci. 2003 Apr;44(4):1716-21. doi: 10.1167/iovs.02-0287. Invest Ophthalmol Vis Sci. 2003. PMID: 12657613
Cited by
-
Reduced folate carrier 1 is present in retinal microvessels and crucial for the inner blood retinal barrier integrity.Fluids Barriers CNS. 2023 Jun 16;20(1):47. doi: 10.1186/s12987-023-00442-3. Fluids Barriers CNS. 2023. PMID: 37328777 Free PMC article.
-
Molecular and biochemical characterization of folate transport proteins in retinal Müller cells.Invest Ophthalmol Vis Sci. 2010 Jun;51(6):3226-35. doi: 10.1167/iovs.09-4833. Epub 2010 Jan 6. Invest Ophthalmol Vis Sci. 2010. PMID: 20053979 Free PMC article.
-
High prevalence of low plasma thiamine concentration in diabetes linked to a marker of vascular disease.Diabetologia. 2007 Oct;50(10):2164-70. doi: 10.1007/s00125-007-0771-4. Epub 2007 Aug 4. Diabetologia. 2007. PMID: 17676306 Free PMC article.
-
Implications of Diabetes-Induced Altered Metabolites on Retinal Neurodegeneration.Front Neurosci. 2022 Jul 13;16:938029. doi: 10.3389/fnins.2022.938029. eCollection 2022. Front Neurosci. 2022. PMID: 35911994 Free PMC article.
-
Regulation of reduced-folate transporter-1 in retinal pigment epithelial cells by folate.Curr Eye Res. 2005 Jan;30(1):35-44. Curr Eye Res. 2005. PMID: 15875363 Free PMC article.
References
-
- Wu G. Retina: The Fundamentals. Philadelphia: WB Saunders; 1995. Diabetic retinopathy; pp. 31–48.
-
- Verma D. Pathogenesis of diabetic retinopathy: the missing link (review)? Med Hypotheses. 1993;41:205–210. - PubMed
-
- Shiels IA, Zhang S, Ambler J, Taylor SM. Vascular leakage stimulates phenotype alteration in ocular cells, contributing to the pathology of proliferative vitreoretinopathy. Med Hypotheses. 1998;50:113–117. - PubMed
-
- Hewitt AT, Adler R. The retinal pigment epithelium and interphotoreceptor matrix: structure and specialized functions. In: Ogden TE, Schachat AP, editors. Retina. Vol. 1. St Louis: CB: Mosby; 1997. pp. 58–71.
-
- Hughes BA, Gallemore RP, Miller SS. Transport mechanisms in the retinal pigment epithelium. In: Marmor MF, Wolfensberger TJ, editors. The Retinal Pigment Epithelium: Function and Disease. New York: Oxford University Press; 1998. pp. 103–134.
Publication types
MeSH terms
Substances
Grants and funding
LinkOut - more resources
Full Text Sources
Research Materials
Miscellaneous
