. 2002 Feb 5;99(3):1713-7.
doi: 10.1073/pnas.251675698. Epub 2002 Jan 29.

Leaf-to-shoot apex movement of symplastic tracer is restricted coincident with flowering in Arabidopsis

Affiliations

Leaf-to-shoot apex movement of symplastic tracer is restricted coincident with flowering in Arabidopsis

Andreas Gisel et al. Proc Natl Acad Sci U S A. .

Abstract

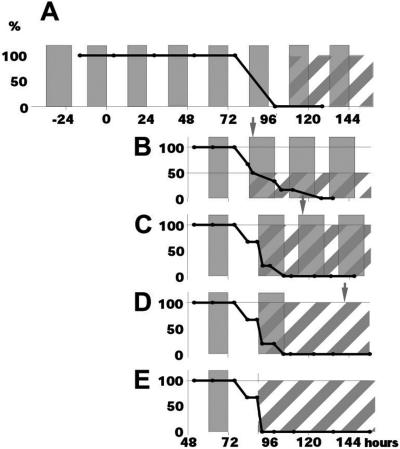
Classical experiments in plant physiology showed that leaves are the source of signals that control the development of flowers from shoot meristems. Additional physiological and genetic experiments have indicated some of the molecules (e.g., gibberellins, cytokinins, and sucrose) that promote flowering in mustards including Arabidopsis. These small hydrophilic molecules are likely to move to the shoot apex symplastically via the phloem and/or via cell-to-cell movement through plasmodesmata. To analyze potential changes in the symplastic trafficking of small molecules during the induction of flowering in Arabidopsis, we measured changes in the flow of symplastic tracers from the leaf to the shoot apex. We previously found that the onset of flowering is coincident with an evident decrease in the leaf-to-shoot trafficking of symplastic tracer molecules; this decrease in trafficking is transitory and resumes when floral development is established. Here we provide detailed analyses of symplastic connectivity during floral induction by monitoring tracer movement under different photoperiodic induction conditions and in a number of genetic backgrounds with altered flowering times. In all cases, the correlation between flowering and the reduction of symplastic tracer movement holds true. The lack of tracer movement during the induction of flowering may represent a change in plasmodesmal selectivity at this time or that a period of reduced symplastic communication is associated with floral induction.


Figures

Figure 1
Figure 1
Different day-night regimes versus trafficking of fluorescent tracer into shoot apices. The gray bars represent the dark periods, light spaces represent daylight periods, and hatched areas represent the times when plants are committed to flowering. The black line indicates the percentage of plants that traffic fluorescent tracer into the shoot apex. In this set of experiments plants were grown for 23 days under noninductive SD8 conditions and then transferred to LD12 conditions to induce flowering. (A) Plants were induced with continuous LD12. (B) After four LD12s all plants were returned to SD8 (note the wider gray bars and narrower white spaces) until bolting. (C) The fourth LD12 was prolonged by 6 h of additional light and subsequently returned to SD8. (D) Plants as in C were given one long (16 h) night and then continuous light until all plants bolted. (E) The fourth LD12 was followed by continuous light. Plants were loaded at different times during the light and dark periods and monitored 3 h later for loading (15). The red arrows in B, C, and E indicate the times at which the apices shown in Fig. 2 were assayed.
Figure 2
Figure 2
Restriction of leaf-to-apex movement of HPTS during the induction of flowering. (A) Shoot apex containing HPTS (green) after 3 h of loading at the end of four LD12s (time point indicated by the arrow in Fig.1B). The strongest loading is seen in primordia. (B) Scanning electron micrograph of the shoot apex in A. (C) Shoot apex of a plant that received 6 additional hours of light at the end of the fourth LD12 and then was placed back in SD8s for a day (time point indicated by the arrow in Fig.1C). No HPTS is evident at the shoot apex. (D) Scanning electron micrograph of the shoot apex in C. (E) The shoot apex of a plant that received 6 additional hours of light at the end of the fourth LD12 and then one SD8 before being placed into continuous light before assay (time point indicated by the arrow in Fig.1D). No HPTS is evident at the shoot apex. (F) Scanning electron micrograph of the shoot apex in E. Leaf primordia generally are triangular in shape (B), whereas flower primordia (f) are radially symmetrical after initiation (F). Chlorophyll autofluorescence appears red. (Scale bar, 60 μm.)
Figure 3
Figure 3
Trafficking of fluorescent tracer to shoot apices under different growth conditions and genetic backgrounds. Wild-type Arabidopsis (Ler), and different flowering-time mutants (in the Ler background) were monitored under different light regimes. (A) Twenty-three SD8s followed by induction with LD12 treatment. (B) Twenty-six SD8 followed by induction with LD16. In A and B the x axes are inductive days (LD12 and LD16, respectively) after SD8 treatment. (C) Ler under continuous LD16s. (D) phyB-6 (23) under continuous LD16. (E) ft-1 (37) under continuous LD16. (F) co (20) under continuous LD16. (G) Continuous SD8s. (H) phyB-6 under continuous SD8. (I) tfl-1 (24) under continuous SD8. In C–I the x axes are days that the plants were grown after vernalization. All data shown are from best-fit analysis using the least-square method, where r2 (the coefficient of determination) was always higher than 0.9 (value of 1 represents a perfect correlation). The red lines represent the number of macro- and microscopically visible organs on the primary shoot (leaves, flowers, and corresponding primordia). The blue lines represent the number of leaves on the primary shoot, which remains constant after flowering (yellow areas). (Leaves were counted after plants had produced inflorescence stems and all leaves were visible macroscopically; these plants were not manipulated but are representatives from the same population of plants used to score primordia and HPTS loading.) The green lines represent the percentage of shoot apices that traffic fluorescent tracer; these data also are simplified into a bar graph containing a gradient of green (plants traffic) to white (no plants traffic).

References

    1. Tooke F, Battey N. Plant Cell. 2000;12:1837–1847. - PMC - PubMed
    1. Chailakhyan M K. Annu Rev Plant Physiol. 1968;19:1–36.
    1. Knott J E. Proc Am Soc Hortic Sci. 1934;31:152–154.
    1. Bernier G, Havelange A, Houssa C, Petitjean A, Lejeune P. Plant Cell. 1993;5:1147–1155. - PMC - PubMed
    1. Evans L T. In: The Induction of Flowering: Some Case Histories. Evans L T, editor. New York: MacMillan; 1969. pp. 457–480.

Publication types

Substances