. 2002 Feb;87(2):802-18.
doi: 10.1152/jn.00409.2001.

Enhancement of multiple components of pursuit eye movement by microstimulation in the arcuate frontal pursuit area in monkeys

Affiliations

Enhancement of multiple components of pursuit eye movement by microstimulation in the arcuate frontal pursuit area in monkeys

Masaki Tanaka et al. J Neurophysiol. 2002 Feb.

Abstract

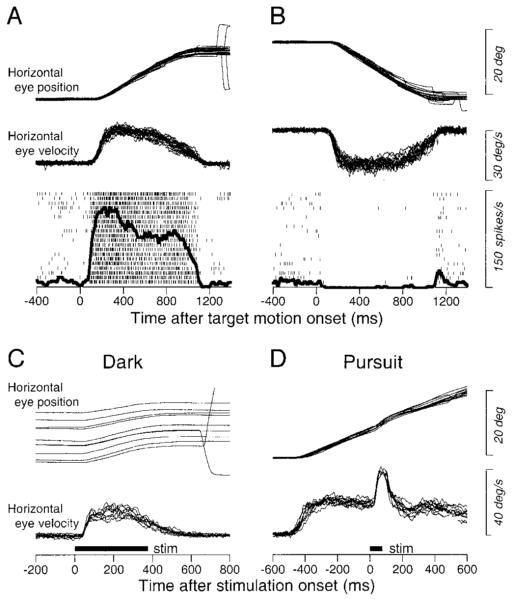
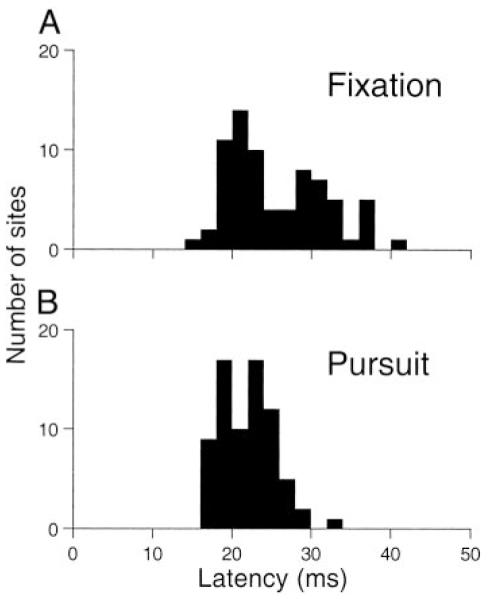
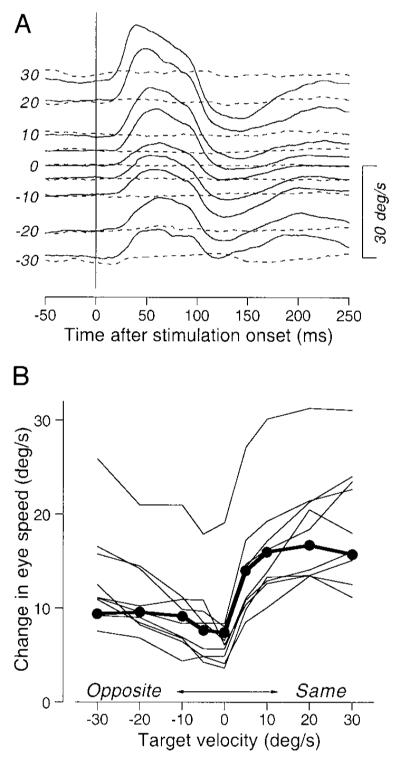
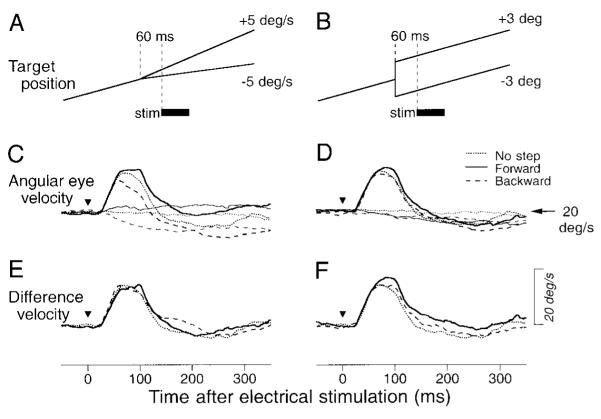
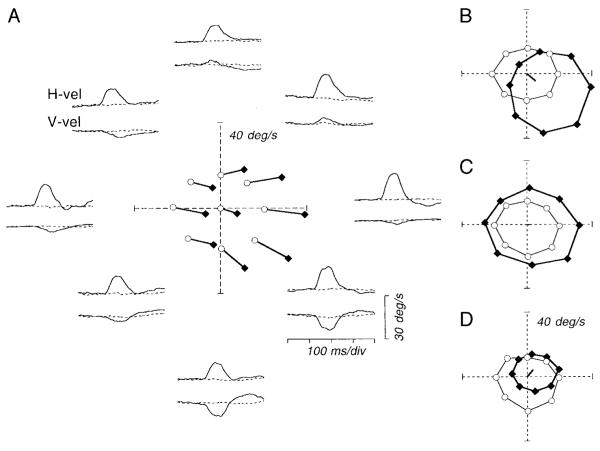
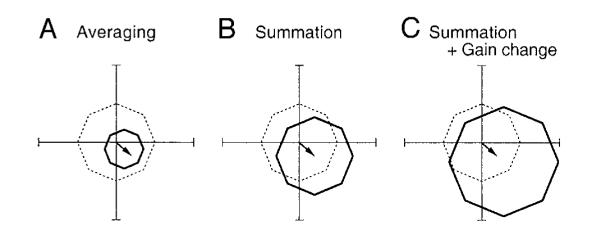
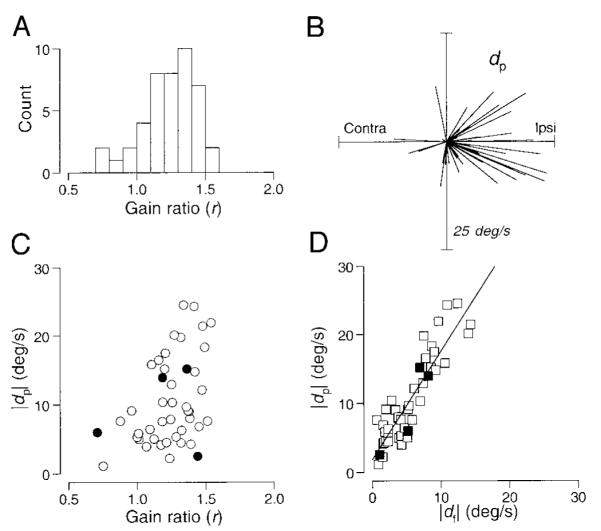
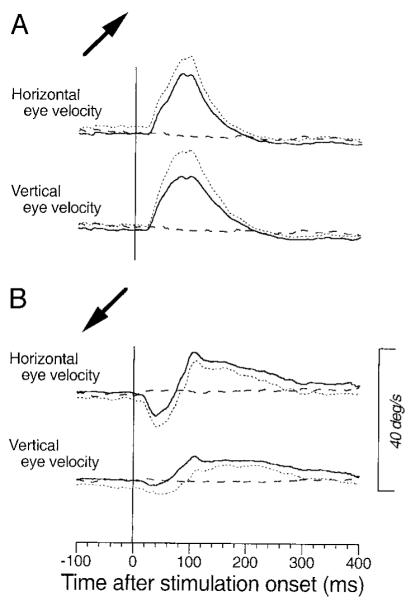
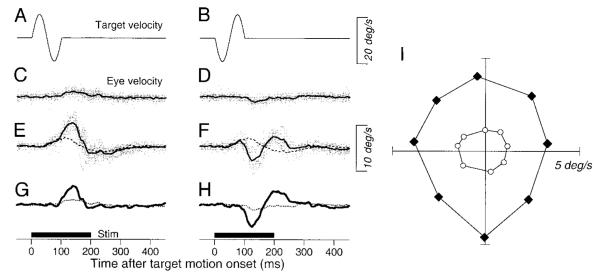
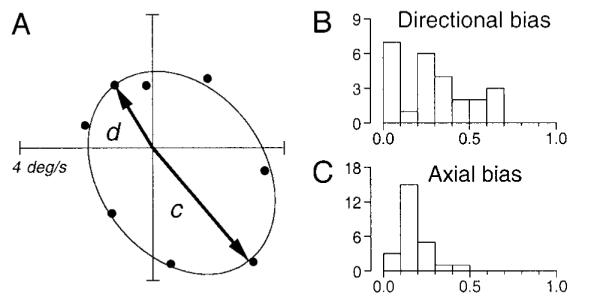
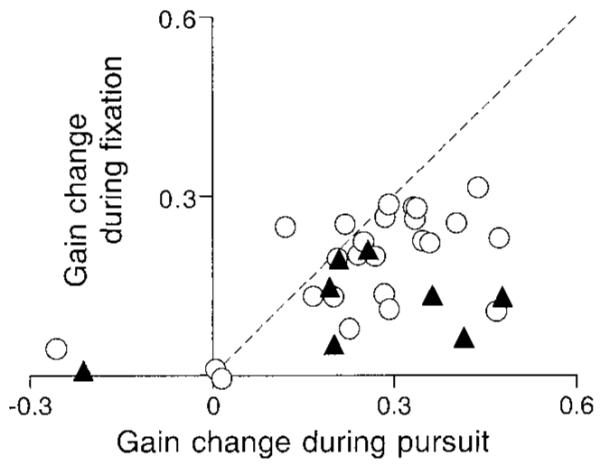
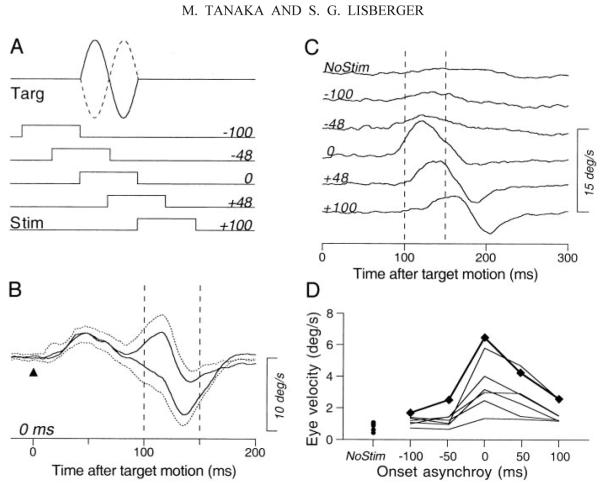
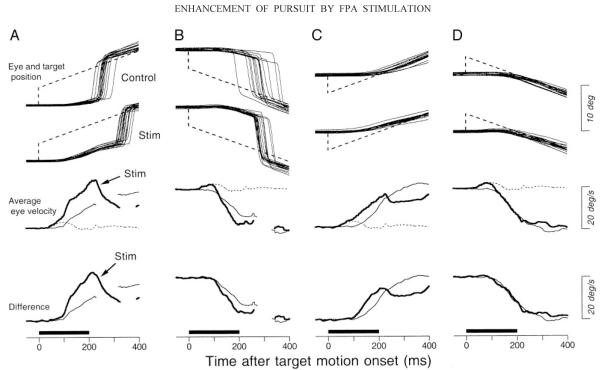
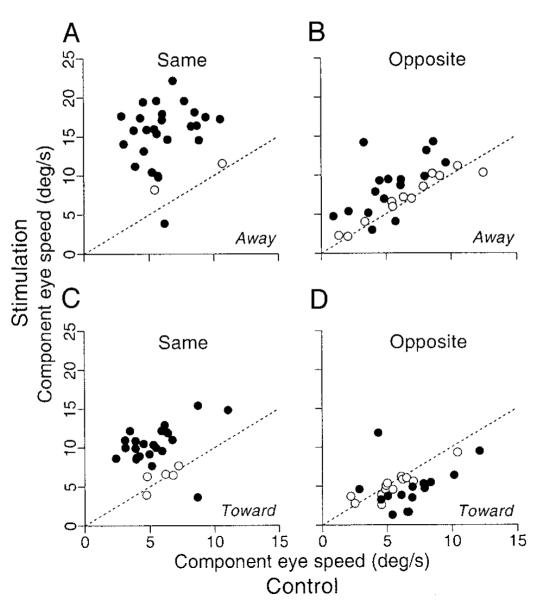
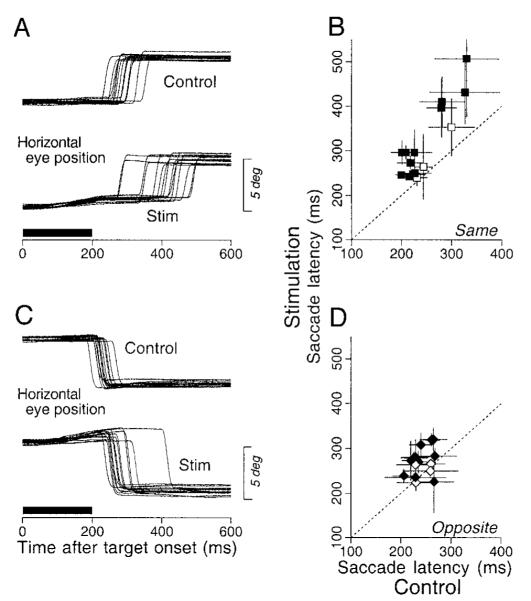
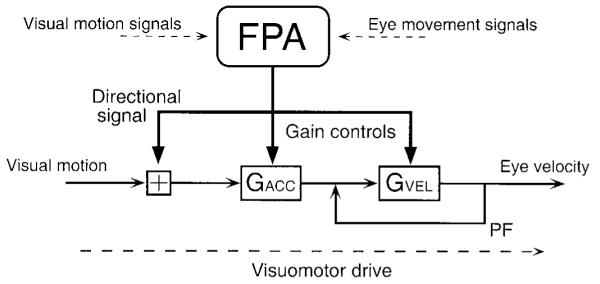
Periarcuate frontal cortex is involved in the control of smooth pursuit eye movements, but its role remains unclear. To better understand the control of pursuit by the "frontal pursuit area" (FPA), we applied electrical microstimulation when the monkeys were performing a variety of oculomotor tasks. In agreement with previous studies, electrical stimulation consisting of a train of 50-microA pulses at 333 Hz during fixation of a stationary target elicited smooth eye movements with a short latency (approximately 26 ms). The size of the elicited smooth eye movements was enhanced when the stimulation pulses were delivered during the maintenance of pursuit. The enhancement increased as a function of ongoing pursuit speed and was greater during pursuit in the same versus opposite direction of the eye movements evoked at a site. If stimulation was delivered during pursuit in eight different directions, the elicited eye velocity was fit best by a model incorporating two stimulation effects: a directional signal that drives eye velocity and an increase in the gain of ongoing pursuit eye speed in all directions. Separate experiments tested the effect of stimulation on the response to specific image motions. Stimulation consisted of a train of pulses at 100 or 200 Hz delivered during fixation so that only small smooth eye movements were elicited. If the stationary target was perturbed briefly during microstimulation, normally weak eye movement responses showed strong enhancement. If delivered at the initiation of pursuit, the same microstimulation caused enhancement of the presaccadic initiation of pursuit for steps of target velocity that moved the target either away from the position of fixation or in the direction of the eye movement caused by stimulation at the site. Stimulation in the FPA increased the latency of saccades to stationary or moving targets. Our results show that the FPA has two kinds of effects on the pursuit system. One drives smooth eye velocity in a fixed direction and is subject to on-line gain control by ongoing pursuit. The other causes enhancement of both the speed of ongoing pursuit and the responses to visual motion in a way that is not strongly selective for the direction of pursuit. Enhancement may operate either at a single site or at multiple sites. We conclude that the FPA plays an important role in on-line gain control for pursuit as well as possibly delivering commands for the direction and speed of smooth eye motion.


Figures

FIG. 1
FIG. 1
Criteria for selection of stimulation sites. A and B: activity of a pursuit-related neuron with ipsiversive (rightward) directional preference during tracking of step-ramp target motion to the right (A) or left (B) at 20°/s. From top to bottom, traces are superimposed trials of horizontal eye position and horizontal eye velocity and superimposed rasters and spike density, aligned on the onset of target motion. Rapid deflections associated with small corrective saccades were removed from eye-velocity traces during the maintenance of pursuit. C and D: superimposed trials of the smooth eye movements evoked by electrical stimulation (50 μA, 333 Hz) in the dark (C) and during ongoing pursuit (D). The bold horizontal lines labeled “stim” show the duration of microstimulation.
FIG. 2
FIG. 2
Distribution of latency of smooth eye movements elicited by electrical stimulation of the frontal pursuit area (FPA) during fixation (A) and during the maintenance of pursuit at 20°/s (B). Each histogram shows data from 73 stimulation sites.
FIG. 3
FIG. 3
Effects of target velocity on the magnitude of electrically-elicited smooth eye movements. A: examples of the time courses of average horizontal eye velocity for stimulation with a 75-ms train of pulses at 333 Hz, 50 μA during tracking of different target velocities. Solid and dashed lines, data obtained with and without stimulation. Numbers at the beginning of traces indicate target velocity. The positive numbers indicate rightward target motion. Upward deflections of average traces indicate rightward eye movements. B: amplitudes of the responses to stimulation as a function of target velocity. The positive and negative values of target velocity indicate target motion in the direction of electrically elicited smooth eye movements (Same) or the opposite direction (Opposite). Each connected line indicates data from single stimulation site. The filled symbols connected by thick lines plot measurements made from the data in A.
FIG. 4
FIG. 4
Absence of the effect of retinal events at the time of electrical stimulation on the magnitude of response. A, C, and E: responses to retinal velocity errors. B, D, and F: responses to retinal position errors. A and B: schematic drawings of experiments. A target moving at 20°/s changed velocity by 5°/s (A) or position by 3° (B) when it crossed the center of the screen. The thick bar labeled “stim” indicates the time of microstimulation. C and D: averages of angular eye velocity for stimulation (thick lines) or control (thin lines) trials. Traces are aligned on the onset of stimulation or equivalent time in the nonstimulation controls (triangles). Different line types indicate different directions of image velocity (C) or position (D) relative to ongoing target motion: dotted traces, control trials; solid traces, retinal stimulus in direction of target motion; long dashed traces: retinal stimulus in direction opposite to target motion. E and F: difference eye velocity, documenting the time courses of the difference in eye speed between the stimulation trial and nonstimulation control.
FIG. 5
FIG. 5
Effects of electrical stimulation of the FPA during pursuit in different directions. A: pairs of traces around the polar plot show horizontal eye velocity (H-vel) or vertical eye velocity (V-vel) during the maintenance of pursuit, positioned to coincide with the direction of pursuit. In each pair of traces, the solid and dashed traces show data for the stimulation trial and the nonstimulation control, respectively. The traces start 500 ms after the onset of target motion. For the stimulation trials, the train of stimulation pulses (duration, 75 ms) was delivered 600 ms after the onset of target motion. The polar plot at the center of A shows eye velocity 90 ms after stimulation onset (filled symbols) and at the equivalent time for the controls (open symbols). Data for the same target motion are connected by lines. B—D: examples of the stimulation-evoked responses for 3 other sites. Each set of 8 data points for the stimulation trials (filled symbols) or controls (open symbols) is connected by lines. The thick line starting at the origin of each polar plot is a vector that indicates the direction and amplitude of eye velocity elicited by stimulation during fixation.
FIG. 6
FIG. 6
Patterns of eye velocity predicted from 3 different computations that might account for the interaction of ongoing pursuit and electrical stimulation. The dashed lines in each polar plot indicate control eye velocity during pursuit in 8 directions, and the solid lines connect eye velocity predicted in stimulation trials. The arrows starting from the origin of each polar plot illustrate the eye velocity evoked by electrical stimulation during fixation. Predictions for the interaction of ongoing pursuit and electrical stimulation are: vector average (A), vector summation (B), and vector summation with omnidirectional enhancement of pursuit eye velocity (C).
FIG. 7
FIG. 7
Quantitative analysis of the interaction between ongoing pursuit and the eye movements evoked by electrical stimulation for 44 sites. Data were fitted by the equation, S = r*C + dp, where r represents the ratio of pursuit gain and dp represents the directional component injected during pursuit. A: distribution of the gain term (r). B: polar plot where each line is a vector showing the direction and amplitude of the eye velocity caused by stimulation during pursuit (dp). C: relationship between the size of the eye movement evoked by stimulation during pursuit (dp) and the gain enhancement of ongoing pursuit (r). The correlation coefficient was 0.41. D: amplitude of the eye velocity caused by stimulation during the maintenance of pursuit (dp) compared with that during fixation (df). The regression line has a slope of 1.58, a y intercept of 1.84, and the correlation coefficient was 0.90. In C and D, each point shows data from a single stimulation site; filled symbols indicate measurements from the data shown in Fig. 5.
FIG. 8
FIG. 8
Evidence for the presence of 2 components with different time courses resulting from FPA stimulation. Averages of eye velocity (—) are aligned on the onset of stimulation applied during the maintenance of pursuit. . . . , the mean plus 1 SD. - - -, average eye velocity in the nonstimulation control trials. Stimulation of this site during fixation elicited smooth eye movements in right-up direction. The → at the left of each panel indicate the direction of pursuit during stimulation. A: right and up. B: left and down. → in A also indicates the direction of the eye movement evoked by stimulation at this site during fixation. Stimulation was applied for 75 ms starting 600 ms after target motion onset. Target speed was 20°/s.
FIG. 9
FIG. 9
Example data from a stimulation site showing the enhancement of the responses to perturbation of a stationary target. A and B: the central fixation target underwent a perturbation that caused velocity to undergo a single cycle of a 10 Hz, ±10°/s sine wave with the initial component upward (A) or downward (B). C and D: vertical eye velocity evoked by the perturbation without electrical stimulation. E and F: responses to the target perturbation in the presence of electrical stimulation. In E and F, the broken line shows the average of the responses to electrical stimulation during fixation of a stationary target. In C—F, the gray traces show the responses in all individual trials, and the black bold traces show the average eye velocity. G and H: comparison of the average vertical eye velocity to the perturbation in the presence (bold solid traces) and absence (fine dotted traces) of electrical stimulation. The bold horizontal lines labeled “stim” below G and H show the time of stimulation. I: polar plot showing the size and direction of responses to target motion in 8 different directions. The filled symbols indicate responses with electrical stimulation, whereas the open symbols indicate those without stimulation. Data were obtained from a different site than that shown in a similar figure in Tanaka and Lisberger (2001).
FIG. 10
FIG. 10
Quantitative analyses showing the lack of selectivity of enhancement for the direction or axis of target perturbation during fixation. A: symbols plot the difference in responses to target motion between stimulation trials and controls for 8 directions of perturbation at a single stimulation site. —, the best-fitting ellipse. →, vectors from the origin to the 2 ends of the major axis of the ellipse. B: distribution of the directional bias defined as 1– d/c. C: distribution of the axial bias defined by 1– b/a, where a and b are the lengths of major and minor axes of the ellipse, respectively. The ordinates of B and C indicate number of stimulation sites.
FIG. 11
FIG. 11
Relationship between the amount of stimulation-induced enhancement of eye velocity during pursuit (x axis) and during stimulation-induced enhancement of the response to a brief perturbation of target motion during fixation (y axis). ○ and ▲, data from different monkeys. - - -, unity slope. Correlation coefficient was 0.55.
FIG. 12
FIG. 12
Effect of timing of stimulation in the FPA on the enhancement of the responses to target perturbations. A: schematic diagram showing the timing of the stimuli. Traces labeled “targ” show the 2 polarities of perturbation velocity along the horizontal meridian. Rectangles labeled “stim” show the timing of 100-ms-duration trains of 200-Hz stimulation pulses at different delays. The numbers to the right of each stimulus marker indicate the time of electrical stimulation relative to the onset of target perturbation in milliseconds. B: example of responses for synchronous perturbations and electrical stimulation. The solid traces show averages of horizontal eye velocity for 2 different polarities of perturbation aligned on the onset of target motion (triangle). The dotted traces indicate 1 SD. The 2 vertical dashed lines indicate the interval used to measure the magnitudes of responses. C: time courses of the responses to perturbation for different times between the onset of microstimulation and the perturbation. The traces are the differences of average eye velocity for the 2 perturbation polarities. Two vertical dashed lines indicate the 50-ms interval during which peaks of the responses were measured. The numbers to the left of the traces indicate the time between the onset of microstimulation and the perturbation. Trace labeled “NoStim” shows the response in the nonstimulation control. D: peak response amplitude as a function of stimulation timing. Each set of connected data points indicates single experiment. Data points connected by bold lines were obtained from the experiment shown in B and C.
FIG. 13
FIG. 13
Effects of electrical stimulation on the initiation of pursuit. Top 2 rows: horizontal eye and target position aligned on the target motion onset for trials with (Stim) or without (Control) electrical stimulation. Third row: average eye velocity in 3 different task conditions. The dashed traces show responses elicited by stimulation without target motion and are the same for A through D. The fine, continuous traces show responses to target motion in the absence of stimulation. The bold traces show responses to target motion during microstimulation. Interruptions in traces indicate intervals when catch-up saccades were so frequent that data from fewer than 5 trials were available for averaging. Bottom row: comparison of the responses to target motion with or without stimulation. The bold trace shows the time course of the difference between eye velocity for target motion during stimulation and that during stimulation alone. The bold horizontal bars below each column indicate the times of stimulation. A: the target stepped and ramped rightward. B: the target stepped and ramped leftward. C: the target stepped leftward and ramped rightward. D: the target rightward and ramped leftward. Step amplitude was always 4° and ramp speed was always 20°/s.
FIG. 14
FIG. 14
Summary of the effects of stimulation on the pursuit initiation. Each graph plots eye speed measured 180 ms after the onset of target motion for trials that included stimulation of the FPA as a function of that during nonstimulation controls. Data for the stimulation trials were measured after subtracting the response to electrical stimulation alone and projecting the remaining response onto the same axis as the eye velocity evoked during the initiation of pursuit without stimulation. The 4 graphs show data sorted by the direction of target motion relative to the target step (“away” or “toward” the position of fixation) and by the direction of pursuit relative to the direction of smooth eye movements elicited by electrical stimulation at given sites (“same” or “opposite”). - - -, a unity slope and would obtain if stimulation did not affect eye velocity. ●, data from a site with statistically significant effects of electrical stimulation (t-test, P < 0.05); ○, data from sites without significant effects.
FIG. 15
FIG. 15
Effects of low-frequency stimulation in the FPA on the latency of saccades. A and C: horizontal eye position aligned on the onset of 4° target step. The top set of superimposed traces shows control responses and the bottom set shows responses during stimulation. The bold horizontal bars indicate the time of stimulation. Data are from the same site as in Fig. 1. B and D: summary of the stimulation effects on saccade latency. Means of saccade latencies in the stimulation trials are plotted as a function of those in controls. Data are presented in separate panels according to the direction of saccades relative to the direction of the stimulation-evoked smooth eye movements (“same” vs. “opposite”). The dashed line in each graph has unity slope, and would obtain if there were no changes in latency. Error bars show ±1 SD. The filled symbols and open symbols plot data from sites showing effects that were or were not statistically significant differences (Kormogorov-Smirnov test, P < 0.05).
FIG. 16
FIG. 16
Location of the electrode penetrations in 2 monkeys (PCK and OLV). The stereotaxic coordinates of the entering points of electrodes are plotted for 2 right hemispheres. Symbols indicate the type of movement elicited by stimulation, according to the key in the top right of the map for monkey OLV. SEM, smooth eye movements; A, anterior; P, posterior; M, medial; L, lateral.
FIG. 17
FIG. 17
Summary diagram showing the postulated effects of FPA stimulation on pursuit. Signals that drive pursuit flow from left to right, starting from “visual motion” and ending with “eye velocity.” The square box with plus sign indicates summing junctions. The boxes labeled GACC and GVEL are variable gain elements that may be under control of the FPA. The FPA injects a directional signal upstream from the 2 variable gain elements and may be able to influence the values of the 2 gain elements. The positive feedback pathway (PF) surrounding GVEL is thought to act as an integrator, and converts visual motion commands for eye acceleration into motor commands for eye velocity.

Similar articles

Cited by

References

    1. Berman RA, Colby CL, Genovese CR, Voyvodic JT, Luna B, Thulborn KR, Sweeney JA. Cortical networks subserving pursuit and saccadic eye movements in humans: an FMRI study. Hum Brain Mapp. 1999;8:209–225. - PMC - PubMed
    1. Burman DD, Bruce CJ. Suppression of task-related saccades by electrical stimulation in the primate’s frontal eye field. J Neurophysiol. 1997;77:2252–2267. - PubMed
    1. Carl JR, Gellman RS. Human smooth pursuit: stimulus-dependent responses. J Neurophysiol. 1987;57:1446–1463. - PubMed
    1. Churchland AK, Lisberger SG. Human smooth pursuit is subject to online gain control. Soc Neurosci Abstr. 2000;26(13):641.
    1. Churchland MM, Lisberger SG. Apparent motion produces multiple deficits in visually guided smooth pursuit eye movements of monkeys. J Neurophysiol. 2000;84:216–235. - PMC - PubMed

Publication types

LinkOut - more resources