. 2002 Feb 1;22(3):1042-53.
doi: 10.1523/JNEUROSCI.22-03-01042.2002.

Spatial buffering during slow and paroxysmal sleep oscillations in cortical networks of glial cells in vivo

Affiliations

Spatial buffering during slow and paroxysmal sleep oscillations in cortical networks of glial cells in vivo

Florin Amzica et al. J Neurosci. .

Abstract

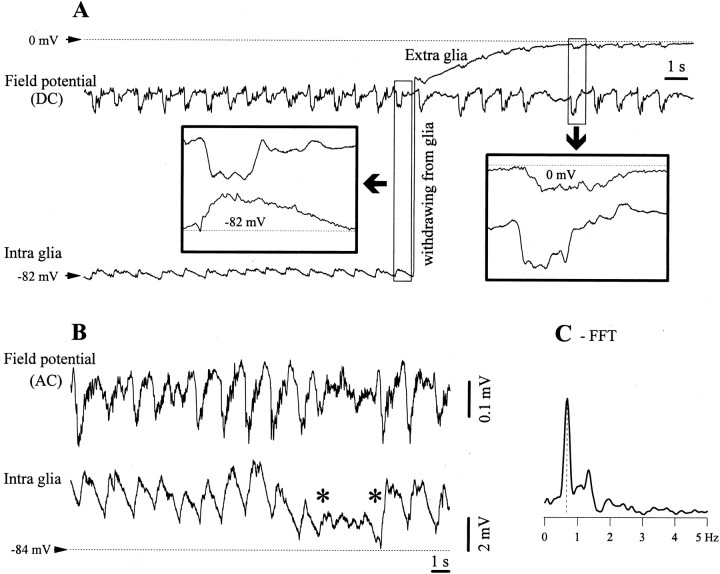
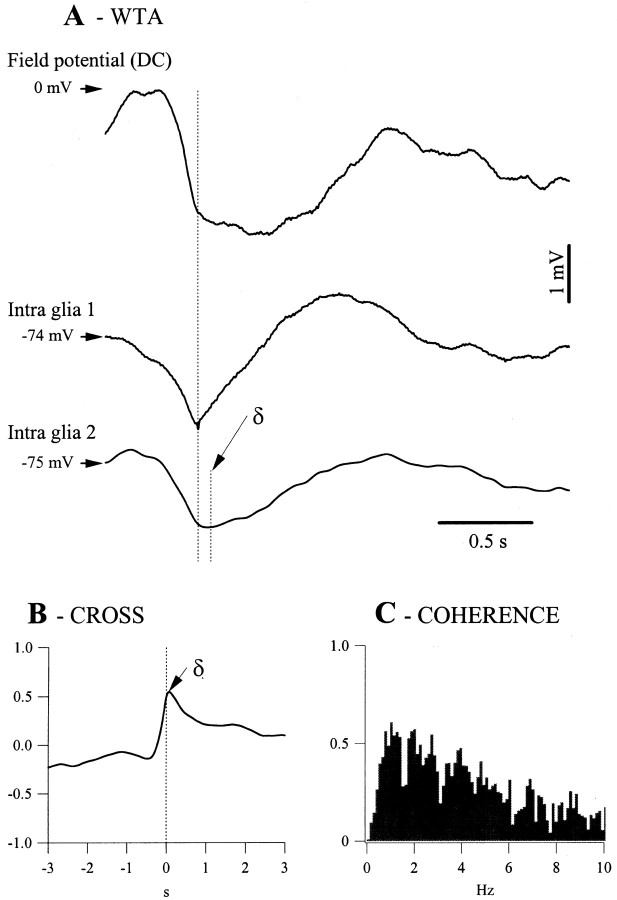
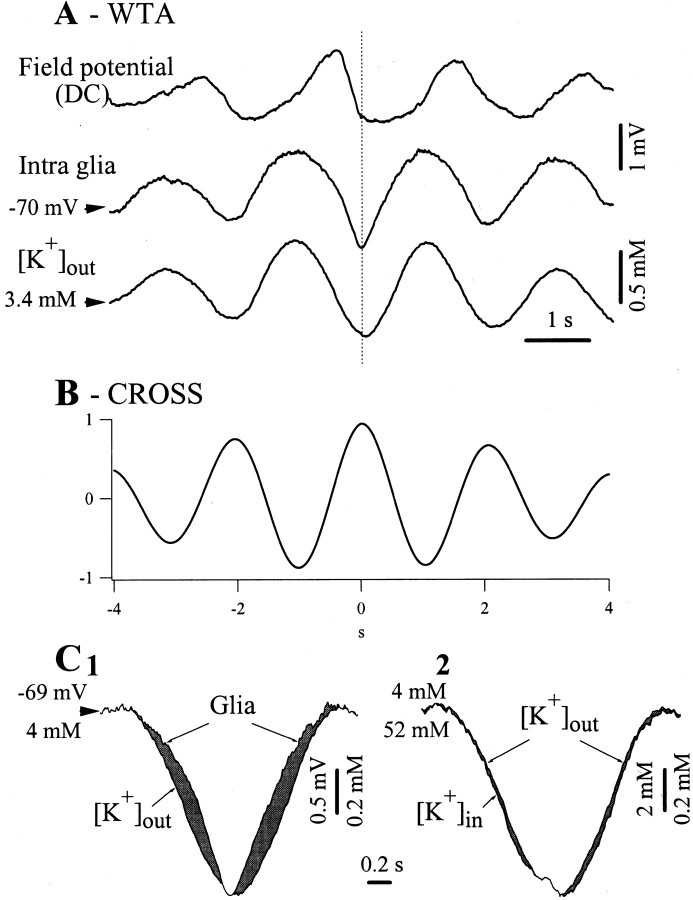
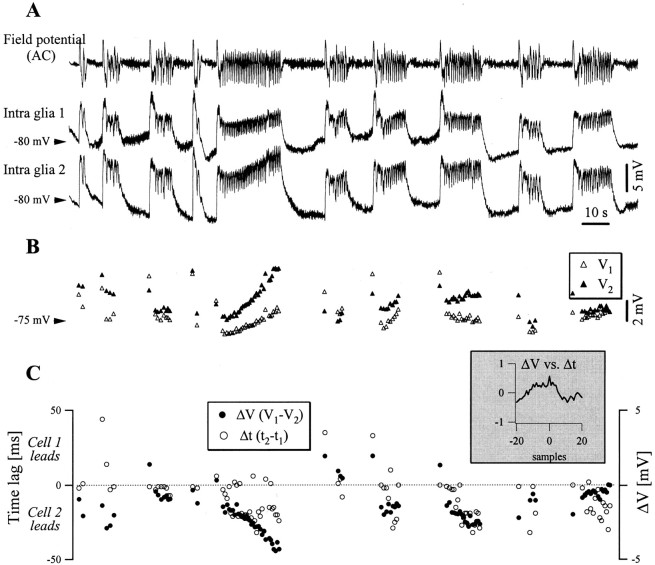
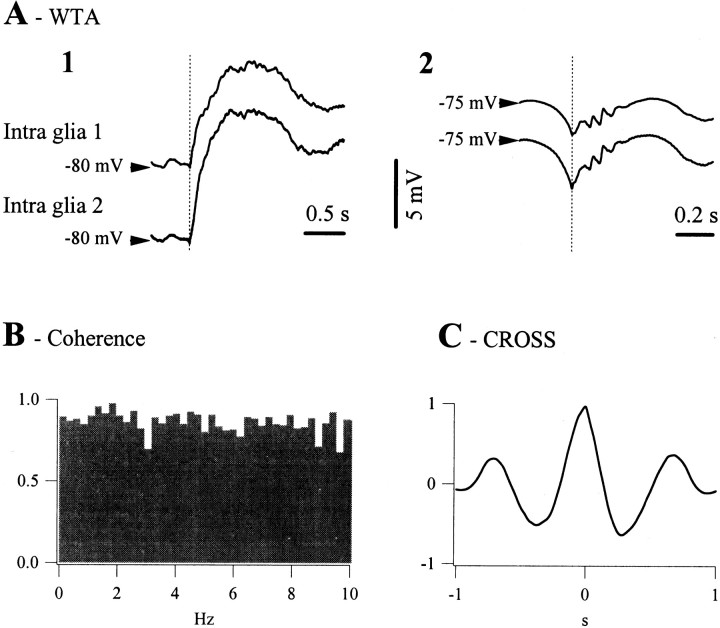
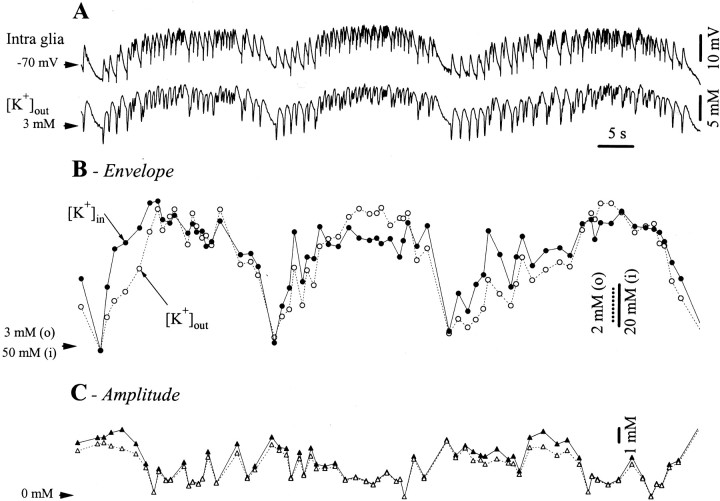
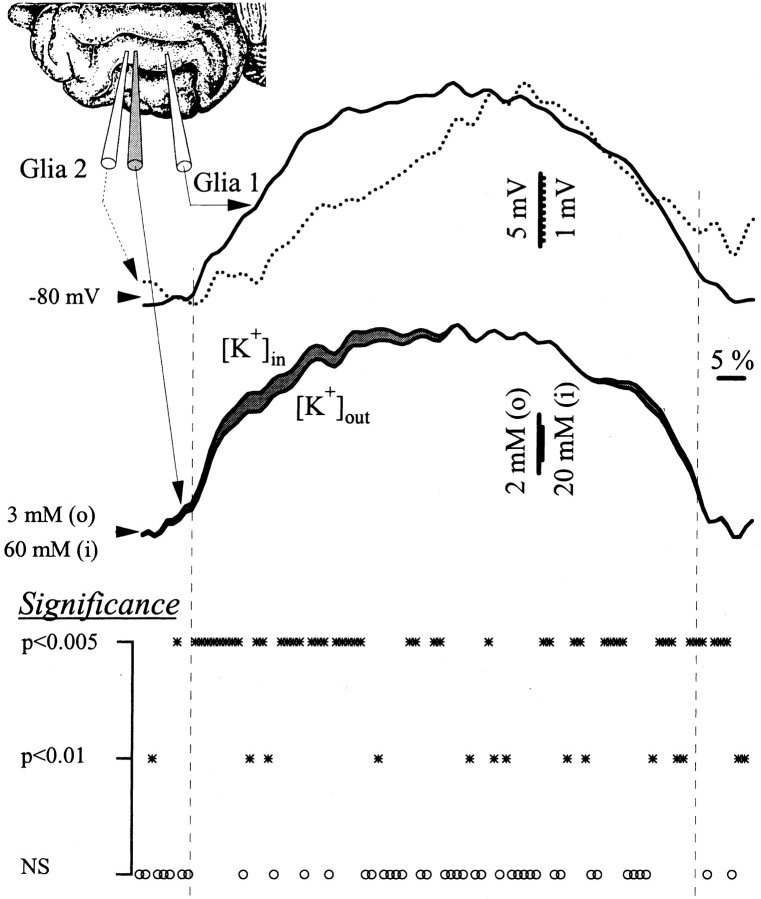
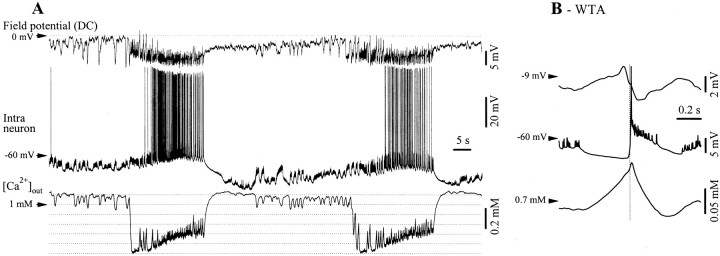
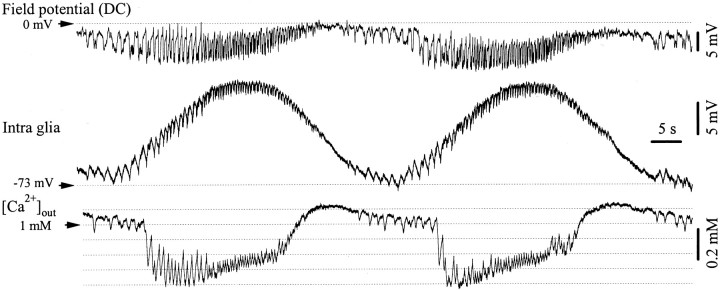
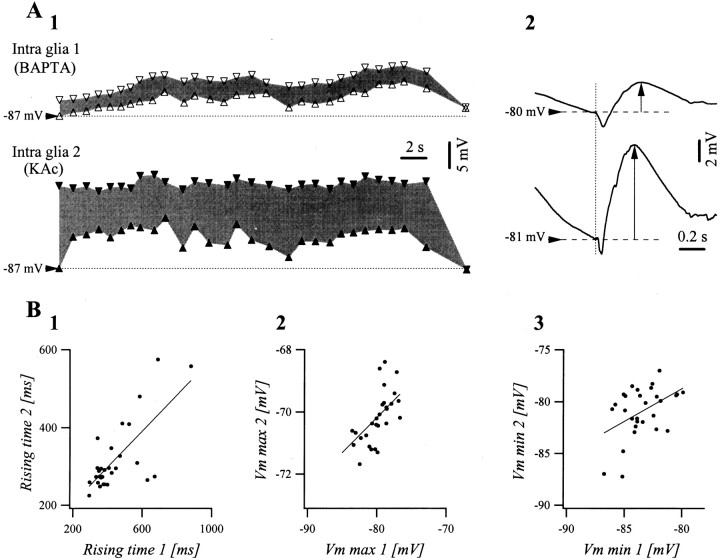
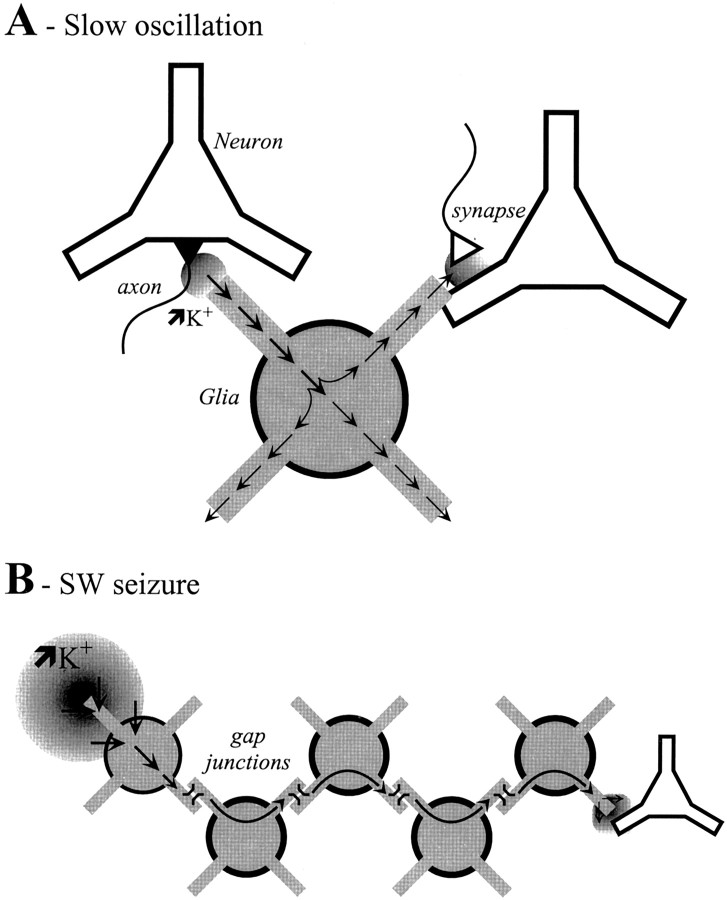
The ability of neuroglia to buffer local increases of extracellular K(+) has been known from in vitro studies. This property may confer on these cells an active role in the modulation and spreading of cortical oscillatory activities. We addressed the question of the spatial buffering in vivo by performing single and double intraglial recordings, together with measures of the extracellular K(+) and Ca(2+) concentrations ([K(+)](out) and [Ca(2+)](out)) in the cerebral cortex of cats under ketamine and xylazine anesthesia during patterns of slow sleep oscillations and spike-wave seizures. In addition, we estimated the fluctuations of intraglial K(+) concentrations ([K(+)](in)). Measurements obtained during the slow oscillation indicated that glial cells phasically take up part of the extracellular K(+) extruded by neurons during the depolarizing phase of the slow oscillation. During this condition, the redistribution of K(+) appeared to be local. Large steady increases of [K(+)](out) and phasic potassium accumulations were measured during spike-wave seizures. In this condition, [K(+)](in) rose before [K(+)](out) if the glial cells were located at some distance from the epileptic focus, suggesting faster K(+) diffusion through the interglial syncytium. The simultaneously recorded [Ca(2+)](out) dropped steadily during the seizures to levels incompatible with efficient synaptic transmission, but also displayed periodic oscillations, in phase with the intraseizure spike-wave complexes. In view of this fact, and considering the capability of K(+) to modulate neuronal excitability both at the presynaptic and postsynaptic levels, we suggest that the K(+) long-range spatial buffering operated by glia is a parallel synchronizing and/or spreading mechanism during paroxysmal oscillations.


Figures

Fig. 1.
Fig. 1.
Slow oscillation in glial cells. A, Intracellular and DC field potential recording before the withdrawal of the micropipette from the glia. The two epochs within the squares are expanded to show, for a cycle of the slow oscillation, the relationship between intraglial and extracellular field potentials (atleft) and the similarity of the two field potentials recorded by two different electrodes. The membrane potential (Vm) of the intracellular recording and the neutral extracellular potential are indicated.B, Short period of activated EEG (betweenasterisks) interrupting the slow oscillation, as recorded from a glial cell and AC depth field potential. The activation of the EEG is associated with relative hyperpolarization of the glial cell. C, Power spectrum of a 75 sec period containing the one in B. The main oscillatory frequency is ∼0.7 Hz with some additional components in the 0.1–1.5 Hz frequency band.
Fig. 2.
Fig. 2.
Synchronization of the slow oscillation in glial pairs from the suprasylvian cortex. A, WTAs (n = 50) from two glial cells recorded simultaneously with the extracellular field potential. WTAs were triggered by the onset of the depolarization in cell 1(longvertical line). The small vertical line marked with the symbol δ corresponds to the average time lags of the second cell with respect to the first (δ = 69 msec). B, Cross-correlation between the time series of the two intraglial recordings that led to the WTAs inA. The correlation peak has an amplitude of 0.56 and an abscissa corresponding to the time lag (δ) measured inA. C, The coherence function calculated for the same time series displays a main coherent oscillatory peak of 0.6 at ∼1 Hz.
Fig. 3.
Fig. 3.
Short-range spatial buffering of extracellular K+ during the slow oscillation. Simultaneous recording of a glia, DC field potential, and extracellular K+ concentration ([K+]out). A, WTAs (n = 50) triggered by the onset of the intraglial depolarization show in-phase variations of the [K+]out and glial potentials. The former were obtained after subtracting the DC field potential from the potentials measured with the ion-sensitive microelectrode (see Materials and Methods). B, Cross-correlation between glial and K+ time series performed over a duration of 2 min. The central correlation peak indicates a correlation coefficient of 94%, with a latency of 7 msec (the intraglial potential precedes the K+ concentration). C1, Superimposition of the intraglial and [K+]out WTA signals expanded at the maximum amplitude, to provide a comparison between the dynamic variations of the two signals (the respective starting and calibration values are indicated separately). C2, Superimposition of the extracellular and intracellular K+ concentration WTAs expanded at the maximum amplitude. The latter ([K+]in) was calculated from the Nernst equilibrium potential. Note little dynamic difference with respect to the [K+]out signal.
Fig. 4.
Fig. 4.
Dynamic time and voltage relationships between pairs of glial cells during SW seizures. A, Recurrent seizures in a dual intraglial recording. B, Dynamic evolution, cycle-by-cycle, of the maximum voltage of the SW complexes in the two glial cells. Open triangles are for the first glia, black triangles are for the second glia, and both are superimposed at the same voltage scale and aligned with the signals in A. Note that the first cell usually started with a higher amplitude depolarization than the second one (open triangle above black triangle), but displayed during the seizure complexes of lower amplitude. C, Evolution of the individual voltage gradients (black circles) and time lags (open circles) during the seizures depicted in A. The time lag scale is atleft, whereas the voltage scale is atright. The two parameters from this panel had similar time courses, as proved by their cross-correlation (inset), with a peak of 0.57 at 0 samples time lag.
Fig. 5.
Fig. 5.
Average voltage relationships and synchronization parameters for the glial pair depicted in Figure 4. A1, WTAs from the first paroxysmal discharges in 10 seizures.A2, WTAs from the ictal SW complexes recorded during the same seizures. B, Coherence function between the two glial cells. The highest peak reached 0.98 at a frequency of 1.9 Hz.C, Cross-correlation between the glial potentials (correlation peak of 0.97 at a time lag of 4 msec, the second cell leading the first one).
Fig. 6.
Fig. 6.
Long-range spatial buffering of K+ during SW seizures. A, Simultaneous recording of intraglial potentials and [K+]out during three recurrent seizures. B, Superimposed envelopes of the seizures inA from the extracellular (dotted linesand open circles) and intracellular K+ (continuous lines and black circles) concentrations. The envelopes were calculated as follows: the onset points for each SW complex were detected in the intraglial trace, then the corresponding voltage (for the glia) and concentration (for the [K+]out) values were extracted. Furthermore, the [K+]in envelope was derived from the Nernst equation relative to the intraglial potentials and the [K+]out envelopes. The superimposed traces (expanded at the maximum amplitude, note different calibration bars: dotted for extracellular andcontinuous for intracellular and resting concentrations) indicate a faster increase at the onset of the seizures in the [K+]in with respect to the [K+]out. C, Superimposition of the intracellular (dotted line andopen circles) and extracellular (continuous line and black circles) concentration amplitudes of the SW complexes over the envelope shown in B. Note similar amplitude values in the two signals.
Fig. 7.
Fig. 7.
Propagation of K+ waves during SW seizures. Dual intraglial recording together with the [K+]out. The disposition of the recording electrodes in the suprasylvian gyrus is shown in theinset. The traces represent the average of 20 normalized seizure envelopes. The top superimposition contains the intracellular seizures in the pair of glial cells expanded at their maximum amplitude (see different voltage calibrations:continuous line for cell 1 anddotted line for cell 2, also corresponding to the envelope traces). From the higher amplitude of the signal, it may be inferred that cell 1 is closer to a presumed seizure focus. The bottom panel displays the intracellular and extracellular K+ concentrations superimposed and expanded at their maximum amplitude. The [K+]in was calculated from the Nernst equilibrium potential in relation with the [K+]out and the intracellular trace that was recorded closely to the K+ microelectrode (2). Toward the beginning of the seizure, the estimated [K+]in raised faster than the [K+]out (gray area between the two traces).
Fig. 8.
Fig. 8.
Decrease of extracellular Ca2+concentrations ([Ca2+]out) during SW seizures. A, Simultaneous intracellular recording of a neuron in the suprasylvian gyrus and of neighboring DC field potentials and [Ca2+]out. SW seizures are accompanied by a persistent drop of ∼0.6 mmof the extracellular Ca2+ concentration and by phasic oscillations of the [Ca2+]outduring the SW complexes (B). The WTAs (n = 40) were triggered by the maximum slope of the neuronal depolarization (vertical dotted line) and depict the relationship between the neuronal paroxysmal depolarization, the field potential and the Ca2+ concentration. Extracellular Ca2+ increases during the hyperpolarizing phase foregoing the onset of the ictal discharge and decreases during the subsequent neuronal depolarization.
Fig. 9.
Fig. 9.
Relationship between [Ca2+]out and glial activities during recurrent SW seizures. Intraglial, DC field potentials and Ca2+ concentrations were measured at short distance (<1 mm) in the suprasylvian gyrus. During seizures, the glial steady depolarization, and presumably the [K+]out, had a different time course from the [Ca2+]out. The latter tended to return to baseline before the end of the seizure.
Fig. 10.
Fig. 10.
Effect of BAPTA (0.1 mm) on the intraglial steady depolarization associated with SW seizures.A1, Envelopes of a SW seizure in a dual intraglial recording at short distance (∼1 mm). The cell 1 was recorded with a pipette containing 0.1 mm BAPTA, and cell2 was recorded with 3 m potassium acetate. The bottom traces (upward triangles) represent the voltages at the onset of the phasic depolarizations, whereas the top traces (downward triangles) correspond to the maximum voltage reached during each SW complex. Thus, the gray surface designates the phasic depolarizations during individual complexes. A2, WTAs of the SW complexes in the two glial cells recorded simultaneously. Both envelopes and phasic events have diminished amplitudes in the recordings with BAPTA. B1, Rising time of individual SW complexes of cell 2 plotted against the same parameter in cell 1 (dots) and the linear fitting (correlation coefficient r = 0.72).B2, Superior envelope in cell 2 against superior envelope in cell 1 (dots) and linear fitting (r = 0.62). B3, Inferior envelope in cell 2 against inferior envelope in cell 1 (dots) and linear fitting (r = 0.45).
Fig. 11.
Fig. 11.
Schematic functioning of the spatial buffering during the slow oscillation (A) and SW seizures (B). A, During the depolarizing phase of the slow oscillation, small and local increases of extracellular K+ (circle) may occur in the proximity of the axon hillock. The neighboring glial cells take it up and redistribute it at sites where the [K+]out has normal values. These locations may be close to a synapse, in which case the synaptic efficiency may be modulated, or close to a neuronal membrane so as to modify the excitability of that membrane. B, Important increases in the [K+]out may not be buffered at short distances, in which case the taken up K+ may travel through the glial syncytium and is externalized at a location with lower [K+]out values, where it would modulate the activity of nearby neurons.

References

    1. Achermann P, Borbély AA. Low-frequency (<1 Hz) oscillations in the human sleep EEG. Neuroscience. 1997;81:213–222. - PubMed
    1. Alici K, Heinemann U. Effects of low glucose levels on changes in [Ca2+]o induced by stimulation of Schaffer collaterals under conditions of blocked chemical synaptic transmission in rat hippocampal slices. Neurosci Lett. 1995;185:5–8. - PubMed
    1. Ammann D. Ion selective microelectrodes. Springer; Berlin: 1986.
    1. Amzica F, Neckelmann D. Membrane capacitance of cortical neurons and glia during sleep oscillations and spike-wave seizures. J Neurophysiol. 1999;82:2731–2746. - PubMed
    1. Amzica F, Steriade M. The K-complex: its slow (<1 Hz) rhythmicity and relation to delta waves. Neurology. 1997;49:952–959. - PubMed

Publication types

MeSH terms

LinkOut - more resources