Comparative Study
. 2002 Jan;14(1):57-70.
doi: 10.1105/tpc.010319.

The gibberellin signaling pathway is regulated by the appearance and disappearance of SLENDER RICE1 in nuclei

Affiliations
Comparative Study

The gibberellin signaling pathway is regulated by the appearance and disappearance of SLENDER RICE1 in nuclei

Hironori Itoh et al. Plant Cell. 2002 Jan.

Abstract

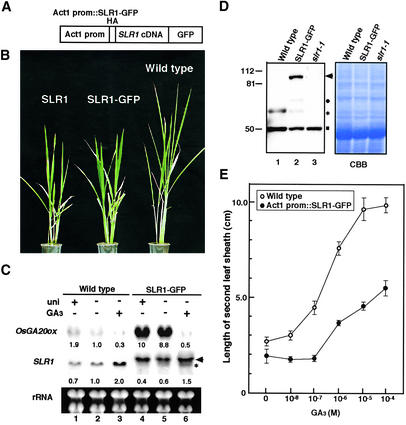
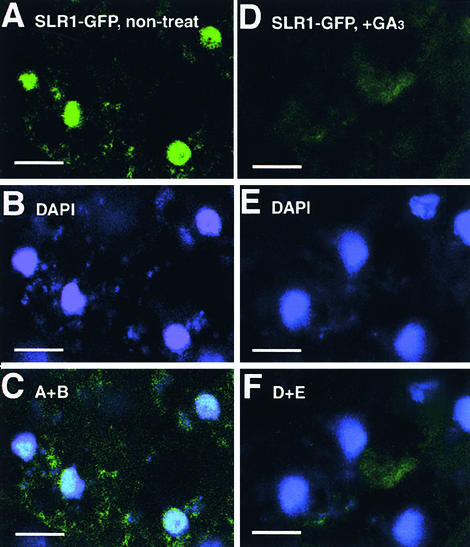
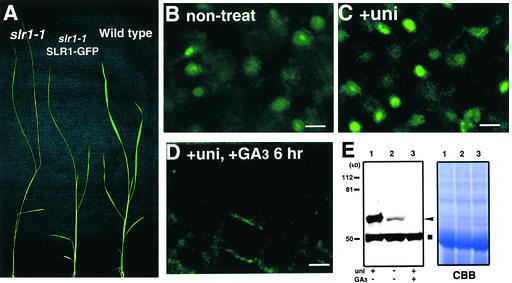
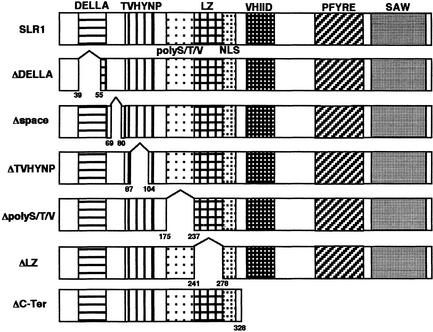
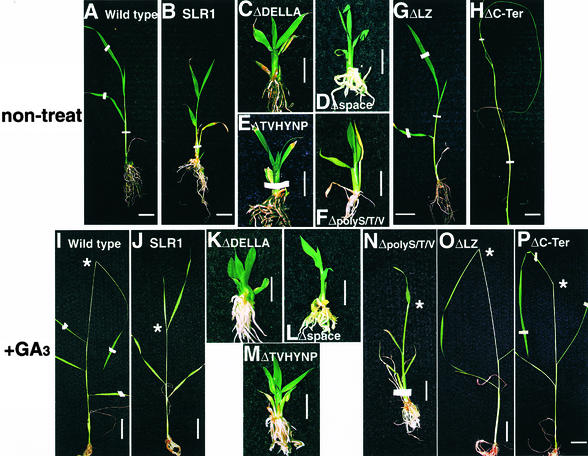
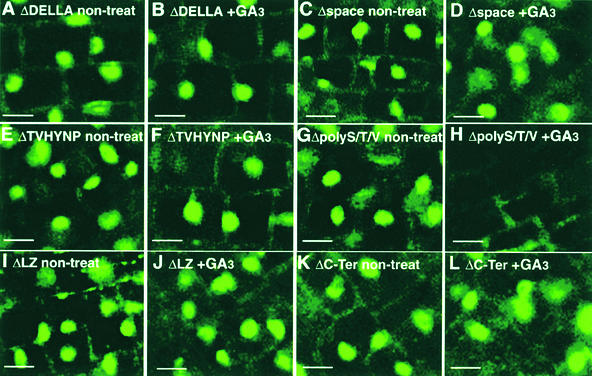
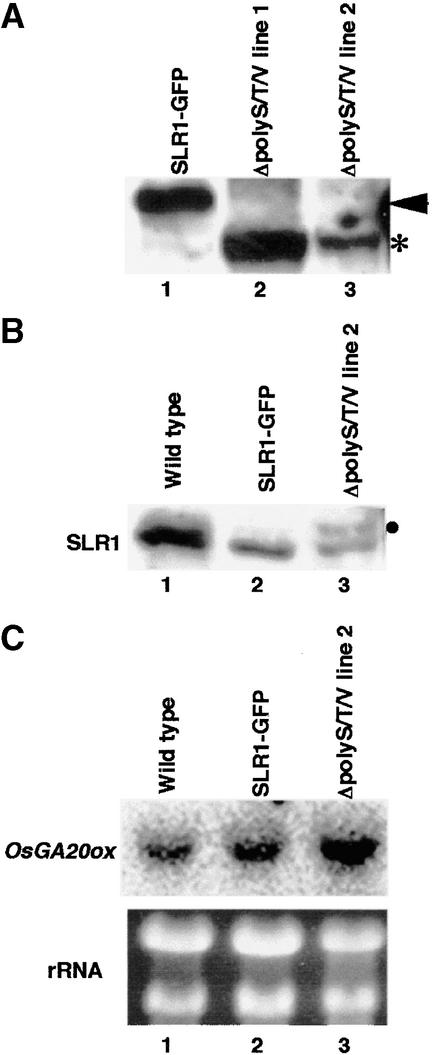
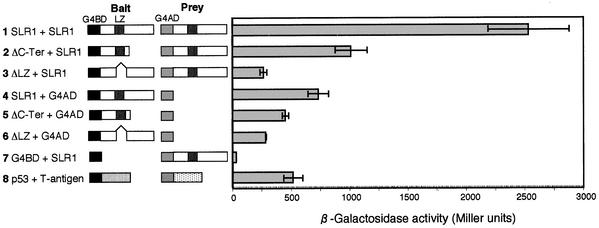
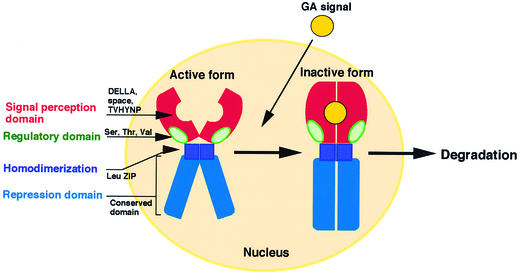
The slender rice1 mutant (slr1) shows a constitutive gibberellin (GA) response phenotype. To investigate the mode of action of SLR1, we generated transgenic rice expressing a fusion protein consisting of SLR1 and green fluorescent protein (SLR1-GFP) and analyzed the phenotype of the transformants and the subcellular localization of GFP in vivo. SLR1-GFP worked in nuclei to repress the GA signaling pathway; its overproduction caused a dwarf phenotype. Application of GA(3) to SLR1-GFP overproducers induced GA actions such as shoot elongation, downregulation of GA 20-oxidase expression, and upregulation of SLR1 expression linked with the disappearance of the nuclear SLR1-GFP protein. We also performed domain analyses of SLR1 using transgenic plants overproducing different kinds of truncated SLR1 proteins. The analyses revealed that the SLR1 protein can be divided into four parts: a GA signal perception domain located at the N terminus, a regulatory domain for its repression activity, a dimer formation domain essential for signal perception and repression activity, and a repression domain at the C terminus. We conclude that GA signal transduction is regulated by the appearance or disappearance of the nuclear SLR1 protein, which is controlled by the upstream GA signal.


Figures

Figure 1.
Figure 1.
Phenotypic Comparison between Wild-Type and SLR1-GFP–Overexpressing Rice Plants. (A) Scheme of the chimeric construct consisting of the SLR1 cDNA fused with GFP at the 3′ side and HA at the 5′ side in an in-frame manner under the control of the rice Actin1 promoter (Act1 prom). (B) Gross morphologies of 45-day-old wild-type (right) and transgenic plants transformed with Act1 prom::SLR1 (left) or Act1 prom::SLR1-GFP (center). (C) Expression of two GA-regulated genes, OsGA20ox and SLR1, in wild-type and SLR1-GFP plants. RNA gel blot analysis was performed using total RNA from wild-type and SLR1-GFP seedlings grown in water with (+) or without (−) 1 μM uniconazol (uni) or 100 μM GA3. Ten micrograms of total RNA was loaded per lane and stained with ethidium bromide (rRNA). The arrowhead and asterisk (middle) indicate the transcript bands corresponding to SLR1-GFP and the endogenous wild-type SLR1, respectively. The values at the bottom of the OsGA20ox and SLR1 panels indicate the relative levels of OsGA20ox and endogenous SLR1 transcript. Each transcript was normalized by rRNA level after quantification using NIH Image software version 1.61. The transcript level in the wild-type plant without any treatments (−GA3, −uni) was set at 1.0. (D) Protein gel blot analysis of the endogenous SLR1 protein and the SLR1-GFP fusion protein in wild-type (lane 1), SLR1-GFP (lane 2), and slr1-1 (lane 3) seedlings. Ten micrograms of protein extracts was loaded per lane and probed with anti-SLR1 antibody. Molecular mass markers (in kD) are indicated at left. The extract from slr1-1 was used as a negative control (lane 3). The arrowhead and asterisk indicate the protein bands corresponding to SLR1-GFP and the endogenous wild-type SLR1, respectively. The circle shows the degraded protein derived from the SLR1-GFP protein, because this protein also was recognized by the anti-HA antibody. The antibody also recognized a 50-kD protein (square), which is present in slr1-1 and therefore is not related to SLR1. As a loading control, the Coomassie brilliant blue (CBB) staining profile is shown. (E) Elongation of the second leaf sheath in response to GA3 treatment in wild-type (open circles) and SLR1-GFP (closed circles) plants. Error bars represent standard deviation from the mean (n = 6).
Figure 2.
Figure 2.
Effect of GA3 on the Subcellular Localization of SLR1-GFP. (A) and (D) Confocal microscopic images of GFP fluorescence in young leaf sections from SLR1-GFP overexpressor lines under the control of the rice Actin1 promoter. (B) and (E) Nuclei in the same cells as in (A) and (D) were stained with DAPI. (C) and (F) Merged images of GFP and DAPI fluorescence. Plants were grown with (+GA3, [D] to [F]) or without (non-treat, [A] to [C]) 100 μM GA3 for several days before GFP fluorescence analysis. Bars = 10 μm.
Figure 3.
Figure 3.
Effect of GA3 on the Amount of SLR1. (A) Complementation of the slr1 phenotype with SLR1 prom::SLR1-GFP. Introduction of SLR1 prom::SLR1-GFP rescued the slender phenotype (middle plant). slr1-1 (left) and wild-type (right) plants are shown as control plants. (B) to (D) Confocal microscopic images of GFP fluorescence in young leaf sections from SLR1 prom::SLR1-GFP transgenic lines. To block GA biosynthesis, the transgenic rice seedlings were pretreated with 1 μM uniconazol ([C] and [D], +uni) and then treated with 100 μM GA3 for 6 hr ([D], +uni, +GA3 6 hr). non-treat indicates normal growth conditions without any treatment (B). Bars = 10 μm. (E) Protein gel blot analysis of the SLR1 protein. Rice seedlings were grown for 1 week under normal conditions (lane 2) or with 1 μM uniconazol (lane 1; uni). For the GA treatment, the seedlings treated with uniconazol then were sprayed with 100 μM GA3 and collected after 6 hr (lane 3). The arrowhead and square indicate the protein bands corresponding to endogenous SLR1 and SLR1 nonrelated protein, respectively. Each lane contains 10 μg of total protein. As a loading control, the Coomassie brilliant blue (CBB) staining profile is shown.
Figure 4.
Figure 4.
Diagram of the Deleted Constructs for Domain Analysis of SLR1. Each domain—DELLA, TVHYNP, Ser/Thr/Val-rich domain (polyS/T/V), LZ, nuclear localization signal (NLS), VHIID, PFYRE motif, and SAW motif—is indicated by different shading. The deleted SLR1 mutants were fused with the GFP coding sequence to generate overproducers for phenotypic analysis (see Figure 5) and subcellular localization studies (see Figure 6). The deletion points in each mutated SLR1 are shown below each box.
Figure 5.
Figure 5.
Gross Morphologies of 10-Day-Old Wild-Type and Transgenic Seedlings Overproducing the Truncated SLR1-GFP Proteins with GA3 Treatment ([I] to [P]) or Nontreatment ([A] to [H]). Plants were grown for 6 days under normal conditions and then treated with or without 100 μM GA3 for another 4 days. Because ΔDELLA, Δspace, ΔTVHYNP, and ΔpolyS/T/V transgenic plants showed a severe dwarf phenotype and never produced any fertile flowers, we used T1 generation plants for the analyses. Asterisks in (I), (J), (N), (O), and (P) show the top of the elongated fourth leaf sheath. Bars = 1 cm.
Figure 6.
Figure 6.
Nuclear GFP Fluorescence Pattern in Young Leaves of Transgenic Plants. The same plants shown in Figure 5 were used for analysis of the nuclear localization of SLR1-GFP. To confirm the nuclear localization of the GFP fluorescence, the positions of nuclei were always tested by DAPI staining. non-treat, nontreatment. Bars = 10 μm.
Figure 7.
Figure 7.
Effect of PolyS/T/V Deletion on the Regulation of GA Action. (A) Protein gel blot analysis of the fusion proteins in an SLR1-GFP–overproducing plant (lane 1) and two independent lines of ΔpolyS/T/V-GFP–overproducing plants (lanes 2 and 3). Crude extracts were extracted from the shoot apices of each plant. Twenty micrograms of total protein was subjected to SDS-PAGE, electroblotted, and probed with an anti-HA antibody. The arrowhead and asterisk indicate the positions of intact SLR1-GFP and ΔpolyS/T/V-GFP proteins, respectively. (B) Endogenous SLR1 protein level in a wild-type plant (lane 1), a SLR1-GFP plant (lane 2), and the ΔpolyS/T/V-GFP line 2 plant used in (A) (lane 3). Protein extracts were subjected to SDS-PAGE and probed with anti-SLR1 antibody. Each lane contains 20 μg of total protein. The circle shows the degraded protein derived from the ΔpolyS/T/V-GFP protein. (C) Level of OsGA20ox transcript. RNA gel blot analysis was performed with total RNA (10 μg) isolated from the shoot apices of the same plants used in (B). All of these samples were prepared from adult plants grown for 30 days.
Figure 8.
Figure 8.
Dimer Formation of SLR1 through the LZ Domain in the Yeast Two-Hybrid Assay. For bait constructs (Bait), full-length SLR1, ΔLZ, or ΔC-Ter (see Figure 4) was fused with the G4BD. For the prey construct (Prey), the full-length SLR1 was fused with the G4AD. The relative lacZ activity of various combinations is presented. p53 and T-antigen (simian virus 40 T-antigen) were used as positive controls to evaluate relative binding affinity. For each pairwise combination, five individual transformants were used to measure relative lacZ activity. Error bars represent standard deviations.
Figure 9.
Figure 9.
Scheme of the Functional Domains of SLR1 for the GA Signaling Pathway. The GA signal (yellow circle) is received by the signal perception domain, which consists of the conserved DELLA and TVHYNP regions and the nonconserved spacer region (red). The SLR1 received with the GA signal is degraded rapidly and disappears in the nuclei. The leucine zipper domain (dark blue) is essential for dimer formation by SLR1. The C-terminal half of SLR1 (blue), which is shared with other GRAS family genes, functions as a repression domain to prevent the action of GA. The Ser/Thr/Val-rich region (green) may work as a regulatory domain through the target sites of O-GlcNAcylation–phosphorylation regulation (see text for details).

Comment in

References

    1. Aberle, H., Bauer, A., Stappert, J., Kispert, A., and Kemler, R. (1997). β-Catenin is a target for the ubiquitin-proteasome. EMBO J. 16, 3797–3804. - PMC - PubMed
    1. Chakraborty, A., Saha, D., Bose, A., Chatterjee, M., and Gupta, N.K. (1994). Regulation of elF-2 α-subunit phosphorylation in reticulocyte lysate. Biochemistry 33, 6700–6706. - PubMed
    1. Chiu, W.-L., Niwa, Y., Zeng, W., Hirano, T., Kobayashi, H., and Sheen, J. (1996). Engineered GFP as a vital reporter in plants. Curr. Biol. 6, 325–330. - PubMed
    1. Chomczynski, P., and Sacchi, N. (1987). Single-step method of RNA isolation by acid guanidinium thiocyanate–phenol–chloroform extraction. Anal. Biochem. 162, 156–159. - PubMed
    1. Chou, T.Y., Gerald, W.H., and Dang, C.V. (1995). c-Myc is glycosylated at threonine 58, a known phosphorylation site and a mutational hot spot in lymphomas. J. Biol. Chem. 270, 18961–18965. - PubMed

Publication types

MeSH terms